In the bustling digital age, where data flows as swiftly as a river, choosing the right analytics tool can be akin to finding the perfect vessel to navigate these waters. Today, we’re embarking on an exploratory journey between two prominent ships in the sea of analytics: SAS Visual Analytics and Segment. Both tools promise to steer businesses towards the treasure trove of insights hidden in their data. Yet, they sail under different flags, designed for distinct voyages. Let’s set sail with an exploration of their integration capabilities, ensuring our journey is simple, engaging, and steers clear of the treacherous waters of complexity.
| SAS Visual Analytics | Segment |
|---|---|
 |  |
| G2 Score -4.4 out of 5 | G2 Score -4.6 out of 5 |
| TrustRadius Score -8.4 out of 10 | TrustRadius Score -8.3 out of 10 |
Integration Capabilities: The Anchor of Analytics
In the vast ocean of data analytics, the ability of a tool to integrate with various data sources and platforms is the anchor that keeps your insights steady against the tide. It’s about how seamlessly you can merge different streams of data into a coherent whole, ready for exploration. Here’s how SAS Visual Analytics and Segment fare in these crucial waters.
SAS Visual Analytics: The Sturdy Galleon
SAS Visual Analytics is like a sturdy galleon, built with the strength to handle a wide variety of data sources. It’s designed for enterprises that deal with vast oceans of data, offering robust integration capabilities that can pull in information from across an organization’s landscape. Whether it’s structured data residing in traditional databases or unstructured data floating in the digital ether, SAS Visual Analytics is equipped to bring it all aboard.
The platform’s power lies in its ability to not only integrate data but also to cleanse and prepare it for analysis, ensuring that businesses aren’t navigating their course with murky insights. However, the sophistication of this galleon means that setting sail with SAS Visual Analytics often requires a seasoned crew of data specialists. The tool’s depth and breadth offer unparalleled insights for those who know how to navigate its capabilities.
Segment: The Agile Schooner
In contrast, Segment sets sail as an agile schooner, designed with speed and flexibility in mind. It excels in the digital realm, specifically in integrating customer data from various touchpoints across the web and mobile applications. Segment acts as a central hub, collecting data signals and dispatching them to other tools and systems where they can be analyzed and acted upon.
What makes Segment stand out is its focus on real-time data integration. It ensures that businesses can respond swiftly to changes in customer behavior, adjusting their sails as the wind shifts. This agility makes Segment particularly appealing for startups and digital-first companies that prioritize speed and responsiveness in their analytics journey. While it may not match the raw power of SAS Visual Analytics in handling complex, enterprise-level data landscapes, Segment offers clarity and swiftness in navigating the digital seas.
Pricing: The Treasure Map to Value
In the realm of analytics tools, pricing structures can be as diverse as the seas are wide. They can range from straightforward subscription models to more complex, usage-based pricing that considers the depth and breadth of your data exploration. Here’s how SAS Visual Analytics and Segment chart their courses in pricing.
SAS Visual Analytics: Navigating Complex Waters

SAS Visual Analytics, with its comprehensive suite of analytics capabilities, typically follows a licensing model that can vary significantly based on the scale and scope of deployment. This model might include upfront licensing costs, annual renewal fees, and potentially additional costs for server infrastructure or cloud services, depending on the deployment method chosen (on-premises vs. cloud).
Because of its enterprise-level positioning, the cost of SAS Visual Analytics can be on the higher end, reflecting its depth of features, scalability, and the robust support offered. Organizations considering SAS Visual Analytics should prepare for a detailed discussion with SAS representatives to tailor a package that fits their specific needs, which can include considerations for the number of users, amount of data processed, and level of access to SAS’s support and consultancy services.
Segment: Charting a Clearer Course

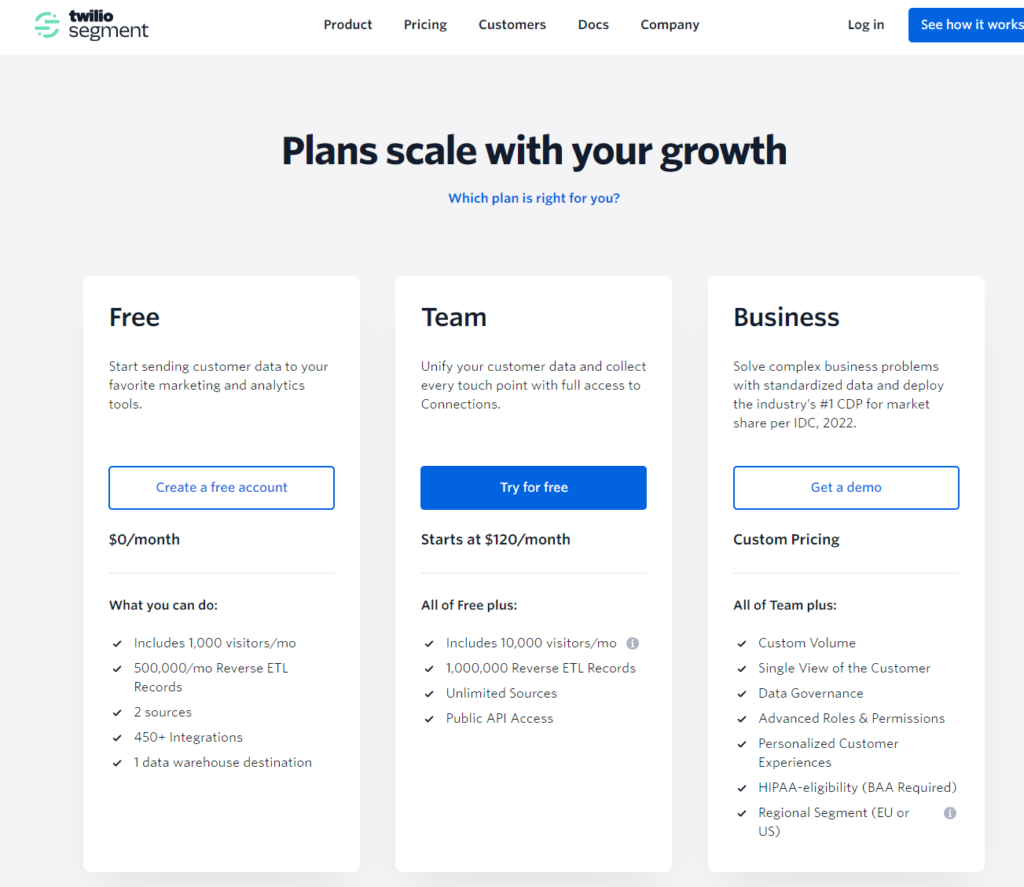
Segment offers a clearer, more navigable pricing model, typically based on usage with free entry-level options and scalable plans that grow with your business. Its pricing is structured around the number of monthly tracked users (MTUs) and the suite of features required, making it easier for startups and mid-sized businesses to predict costs as they scale their operations.
Segment’s transparent, tiered pricing model allows businesses to start with basic features and upgrade as their needs evolve, without substantial upfront costs. This flexibility is particularly appealing for digital-first businesses that need to adapt quickly to changing market dynamics and customer behaviors.
User Experience and Ease of Use: Setting the Sails for Smooth Navigation
The user experience of an analytics tool encompasses the design, intuitiveness, and overall ease with which users can achieve their objectives, from data integration to insight generation. Here’s how our contenders ensure their users can set the sails for smooth navigation through their data.
SAS Visual Analytics: The Commanding Ship
SAS Visual Analytics, much like a commanding ship, is built with a broad deck of features and controls designed for comprehensive data exploration. It offers a wide array of analytical capabilities, from basic reporting to advanced predictive analytics. The platform is designed with the enterprise user in mind, providing deep insights through a powerful suite of tools.
However, the robustness of SAS Visual Analytics can sometimes mean that its UX has a steeper learning curve, especially for users not versed in data science or analytics. Navigating through its extensive features and capabilities can require some initial training and adaptation. But for those willing to climb the rigging, SAS Visual Analytics offers a captain’s view of the data seas, with powerful tools to steer the enterprise ship through complex analytical journeys.
Segment: The Agile Cutter
Segment, on the other hand, is like an agile cutter, designed for swift maneuverability and ease of use. Its UX is centered around the collection and management of customer data, providing a straightforward and intuitive interface that allows users to integrate data sources with minimal effort. Segment’s focus on real-time data collection and integration makes it particularly user-friendly for marketers, product managers, and developers looking to understand and engage with their audience effectively.
The streamlined UX of Segment means that users can quickly set up data pipelines and begin extracting valuable insights without a steep learning curve. This ease of use does not come at the expense of power; Segment offers deep functionality for segmenting and analyzing customer data, making it a nimble vessel for navigating the digital data waters.

Related: Check out our free SEO suite

Customer Support and Community Engagement: Your Crew and Fellow Voyagers
The support provided by an analytics tool’s vendor and the vibrancy of its user community can be a lighthouse guiding users to safe harbor, offering assistance, advice, and camaraderie. Here’s how SAS Visual Analytics and Segment stand by their captains and crew.
SAS Visual Analytics: The Experienced Sea Captains
SAS Visual Analytics benefits from SAS’s long history in the analytics ocean. Its customer support is akin to having experienced sea captains at your beck and call. Users have access to a wide range of support options, including detailed documentation, user forums, and direct support from SAS’s experts. This ensures that when technical squalls hit or when you need advice on navigating complex analytical challenges, help is on the horizon.
Moreover, SAS’s global presence means its support network is vast and varied, offering assistance in many languages and from different corners of the world. The SAS community is an ocean of its own, filled with seasoned data analysts, statisticians, and business intelligence professionals. Engaging with this community can provide invaluable insights and tips on making the most of SAS Visual Analytics.
Segment: The Agile Crew
Segment, sailing the newer seas of digital analytics, offers a more modern take on customer support and community engagement. Its support system is designed for agility, mirroring the tool’s overall philosophy. With an extensive knowledge base, timely email support, and community forums, Segment ensures that users can quickly find answers to their questions and solutions to their problems.
The Segment community, though younger than SAS’s, is vibrant and growing. It’s populated by digital marketers, product managers, and developers — professionals at the forefront of digital innovation. The community is a great resource for learning best practices, sharing integration tips, and discovering new ways to leverage Segment for data-driven decision-making.
Implementation Time and Complexity: Setting Sail
The journey of implementing an analytics tool involves numerous factors, from initial setup and integration with existing systems to training users and achieving full operational capability. Here’s how SAS Visual Analytics and Segment navigate these initial waters.
SAS Visual Analytics: Charting a Course Through Rich Waters
SAS Visual Analytics, akin to preparing a majestic galleon for a long voyage, involves a more extensive setup and integration process. Its comprehensive platform is designed for depth and breadth, capable of handling complex, large-scale data analytics needs. This means that the implementation can be a significant undertaking, requiring careful planning, coordination, and possibly customization to fit into an organization’s existing data ecosystem.
The time to deployment can vary widely, influenced by factors such as the complexity of the data environment, the specific analytics needs, and the readiness of the organization’s infrastructure. Additionally, training users to navigate and utilize SAS Visual Analytics fully is an essential part of the implementation process, given its robust capabilities and features.
Segment: Catching the Wind Quickly
Segment, on the other hand, is like swiftly outfitting a nimble schooner that’s ready to catch the wind with minimal preparation. Its design focuses on ease of integration and user-friendliness, particularly for digital-first businesses. Segment’s implementation process is streamlined, enabling quick deployment and integration with existing data sources, especially web and mobile platforms.
The platform’s focus on automating data collection and its plug-and-play nature with various analytics and marketing tools mean that businesses can start leveraging insights much faster compared to more complex systems. Training users is also generally less intensive, given Segment’s intuitive interface and straightforward functionality.
Conclusion
Selecting between SAS Visual Analytics and Segment hinges on understanding not just where your business stands today but where you aim to sail in the future. Consider the complexity of your data landscape, the agility with which you need to respond to insights, and the resources you can dedicate to implementing and utilizing these tools. Embarking on your data analytics journey with either SAS Visual Analytics or Segment marks the beginning of a deeper understanding of your operational landscape and customer journey. The insights gleaned from the chosen tool should illuminate paths to optimization, strategic growth, and innovation.
READ NEXT:
- QlikView vs Mixpanel: The Best Analytics Tool for You
- QlikView vs Optimizely: The Best Analytics Tool for You
- SugarCRM vs Vtiger: The Best CRM Tool for You
- QlikView vs Tableau: The Best Analytics Tool for You
- QlikView vs MonsterInsights: The Best Analytics Tool for You
- 11 Marketing Analytics Tools to Elevate Your Data-Driven Strategies
- 29+ Digital Analytics Software to Skyrocket Your Digital ROI


Comments are closed.