WinSavvy Editorial Standards
How this article was created
In today’s fast-paced digital landscape, the right analytics tool isn’t just a luxury; it’s the compass that guides your business through the vast seas of data towards the shores of insight and action. In the quest for this crucial navigation aid, two giants stand out on the horizon: Microsoft Power BI and Tableau. Each offers powerful capabilities to chart your course, but the decision on which to set sail with can be as daunting as choosing between the compass and the sextant. As we embark on this journey to discover the best analytics tool for you, let’s dive into the crucial aspect of Integration Capabilities.
| Microsoft Power BI | Tableau |
|---|---|
 |  |
| G2 Score -4.5 out of 5 | G2 Score -4.4 out of 5 |
| TrustRadius Score -8.3 out of 10 | TrustRadius Score -8.2 out of 10 |
User Experience and Dashboard Usability: Crafting the Map for Insights
The user interface of an analytics tool is like the ship’s wheel; it dictates how easily you can steer through the data. A tool that complicates this journey with a cumbersome interface is akin to a map filled with indecipherable legends; it holds the promise of treasure but makes it nearly impossible to reach.
Microsoft Power BI: Navigating with Intuition
Microsoft Power BI is celebrated for its intuitive design, making it accessible for sailors of all skill levels. Its integration within the Microsoft ecosystem means that it often feels familiar to those already accustomed to Office tools. The drag-and-drop functionality simplifies the process of creating dashboards and reports, making data exploration an engaging journey rather than a daunting task. Power BI’s approach to usability extends to its mobile app, ensuring that insights are readily accessible across devices, allowing decision-makers to stay informed, regardless of where their journey takes them.
Tableau: Mastering the Art of Visualization
Tableau takes the helm with a focus on empowering users through visualization. It’s designed for deep dives into data, providing users with powerful tools to create complex and beautiful visualizations. While Tableau’s interface can be more complex than Power BI’s, it offers unparalleled flexibility and depth in how data can be explored and presented.
Tableau encourages a hands-on approach to data analysis, appealing to those who wish to engage closely with their data, crafting stories that bring insights to life. Its dashboard capabilities are vast, allowing for a level of customization that can turn any dataset into a navigational masterpiece.
Pricing: Charting the Cost of Your Expedition
Understanding the pricing structure of Microsoft Power BI and Tableau is essential, as it impacts not only immediate budget considerations but also long-term strategic planning for your analytics capabilities.
Microsoft Power BI: Navigating Through Clear Waters
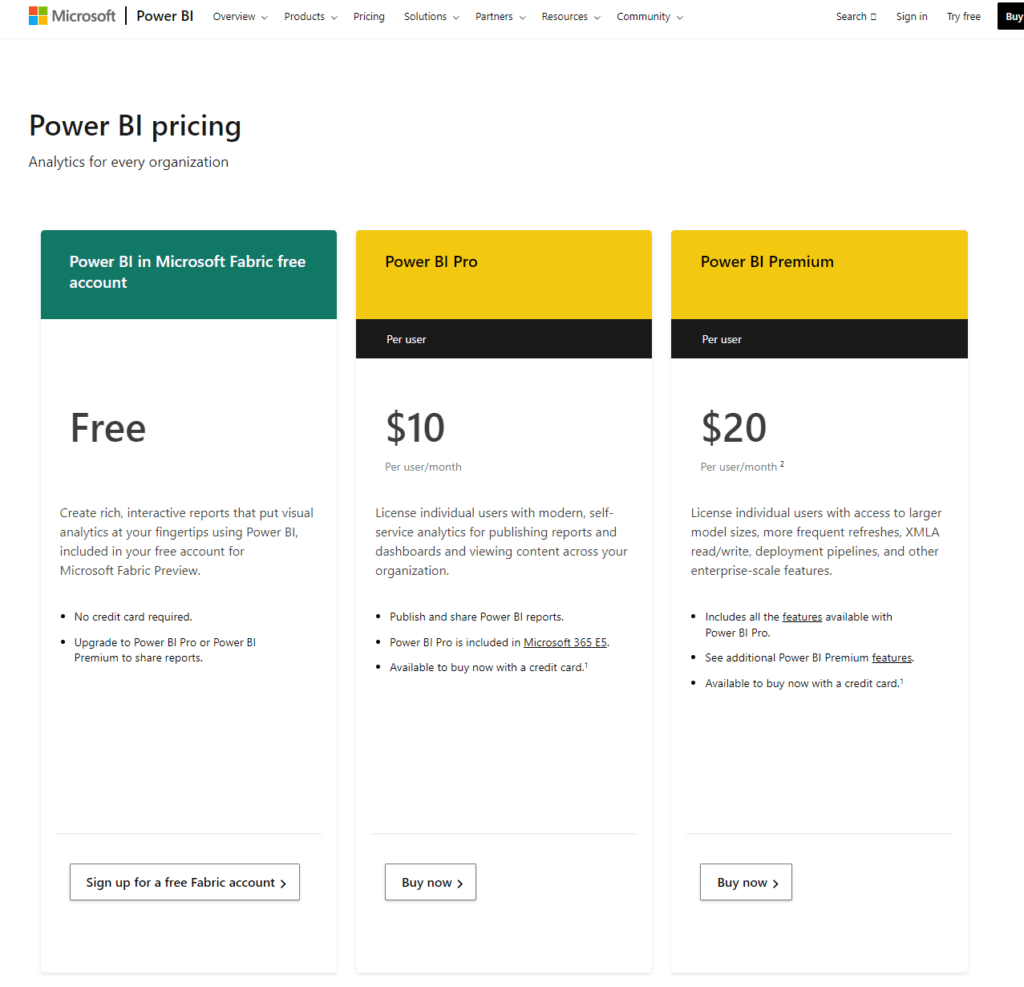
Microsoft Power BI offers a tiered pricing model that caters to a variety of needs, ensuring businesses can find a level that suits their voyage without paying for unnecessary extras this free version allows individual users to create reports and dashboards, making it an excellent starting point for solo data explorers.
For a monthly fee per user, this tier adds collaboration features, more frequent data refreshes, and greater data capacity, suited for teams and small to medium-sized businesses. With pricing based on capacity (per user or per dedicated cloud resources), this option is tailored for larger enterprises or those with extensive data needs, offering advanced analytics capabilities, larger storage, and dedicated cloud resources.
Tableau: Setting Sail with Flexible Options
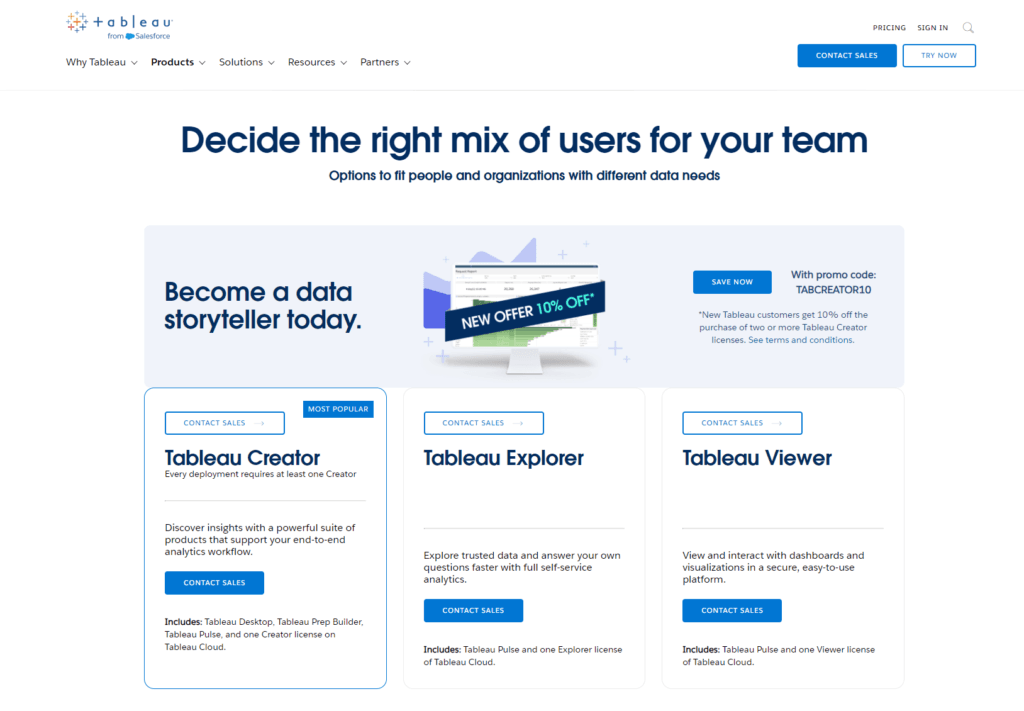
Tableau’s pricing model is designed to accommodate businesses at different stages of their analytics journey, offering both individual and enterprise solutions, aimed at users who create and publish content, this package includes Tableau Desktop and Prep Builder, with pricing per user. It’s ideal for analysts and power users who need to prepare, create, and share complex analyses.
Targeted at users who explore data saved in Tableau Server or Tableau Online, this option requires fewer technical skills and is priced per user, making it suitable for teams needing to explore data and discover insights. Designed for users who access and interact with dashboards and visualizations, this is the most basic tier, allowing broad access to insights at a lower cost per user.
Integration Capabilities: The Keystone of Data Analytics
In the realm of data analytics, the ability to seamlessly integrate with a multitude of data sources and platforms is akin to having a skilled crew on board; it ensures a smooth and efficient voyage. Here’s how Microsoft Power BI and Tableau fare in their capacity to meld with your existing digital ecosystem.
Microsoft Power BI: A Versatile Fleet
Microsoft Power BI is renowned for its broad integration capabilities, designed to connect with a wide array of data sources, both on-premises and in the cloud. From SQL databases and Excel spreadsheets to Salesforce and Google Analytics, Power BI ensures that businesses can consolidate their data from various streams into a cohesive analytical view.
This broad horizon of connectivity is bolstered by Power BI’s ability to integrate with Azure services, providing advanced analytics and AI capabilities within the same ecosystem. For organizations navigating through diverse software and systems, Power BI acts as a unifying force, bridging isolated data islands into a comprehensive map for exploration.
Tableau: Charting Deep and Clear Waters
Tableau, on the other hand, offers its prowess in handling data from virtually any source, priding itself on its powerful data connection capabilities. It excels in not only integrating with a broad range of databases, web data connectors, and cloud services but also in its ability to blend data from multiple sources effectively, allowing for deeper insights. Tableau’s focus on data visualization pushes the boundaries of how data can be analyzed and presented, making it a preferred tool for businesses that prioritize depth and clarity in their data exploration.
Scalability and Performance: Ensuring Your Ship Can Handle the High Seas
The scalability and performance of an analytics platform determine how well it can grow with your business and handle the increasing demands of data analysis. Let’s examine how Power BI and Tableau fare in these crucial areas.
Microsoft Power BI: Sailing Smoothly on Growing Seas
Microsoft Power BI is designed to grow with your organization. It offers scalability that caters to businesses of all sizes, from small startups to large enterprises. With its cloud-based infrastructure, Power BI can efficiently handle large volumes of data and complex analytical models. The performance remains robust, even as the demand for quicker and more complex insights increases.
Power BI ensures that users experience minimal latency, with optimized data refresh rates and responsive dashboards, allowing for real-time decision-making. Additionally, Power BI’s integration with Azure provides an advanced scalability option, offering more power and storage as needed. This ensures that businesses can expand their analytics capabilities seamlessly as they navigate through larger data landscapes.
Tableau: Charting a Course Through Data-Intensive Waters
Tableau is renowned for its ability to handle massive datasets and complex visualizations with ease. It stands out for its performance, particularly in rendering intricate dashboards and visualizations that can transform large data sets into insightful and actionable information.
Tableau’s architecture supports scalability, both on-premises and in the cloud, allowing businesses to adjust their deployment based on their growth and data analysis needs. With Tableau, users can connect to virtually any data source, scaling their analytics efforts without compromise. The platform is engineered to optimize data queries, reducing load times and enhancing the user experience, even as the volume of data expands.
Community Support and Learning Resources: Navigating with the Stars
The richness of a platform’s community and the breadth of its educational resources are crucial for both novice sailors and seasoned captains in the data analytics seas. Here’s how Microsoft Power BI and Tableau support their users’ journeys.
Microsoft Power BI: A Constellation of Support
Microsoft Power BI benefits from a vast and vibrant community, consisting of users from around the globe who contribute to forums, share insights, and offer solutions. The Power BI Community is a treasure trove of knowledge, with discussions that range from basic navigation to advanced data modeling techniques.
In addition to community support, Microsoft provides extensive learning resources through its Power BI Guided Learning platform, documentation, and free online courses. These resources are designed to help users at all levels, from beginners to advanced, enhance their skills and make the most of the platform. The integration with other Microsoft products also means that users often find it easier to get support and resources within the same ecosystem.
Tableau: Charting Your Course with Expert Guides
Tableau prides itself on a highly engaged community, where users, from data enthusiasts to industry experts, share their experiences, visualization techniques, and custom solutions. The Tableau Community Forums are a dynamic platform for seeking advice, exchanging ideas, and finding inspiration from a global network of data lovers.
Tableau further supports its users’ growth and learning through Tableau Public, where users can publish their visualizations and explore others’ work, and through Tableau Academy, offering a wide range of training materials and courses. Tableau’s emphasis on visual storytelling is reflected in its learning resources, encouraging users to not just analyze data, but to communicate it effectively.
Customer Support and Service: The Crew Behind the Analytics Journey
The strength and accessibility of customer support can be the difference between sailing smoothly and getting lost at sea. Let’s see how Microsoft Power BI and Tableau ensure you have the support you need to navigate the data analytics waters.
Microsoft Power BI: Navigating With a Supportive Fleet
Microsoft Power BI users benefit from a comprehensive support system that encompasses both the vast online community and direct support options. For direct assistance, Power BI offers support plans that can be scaled according to business needs, including a basic plan available to all users and more advanced plans offering faster response times and more in-depth support.
Additionally, the Power BI community forums are a rich resource for user-generated solutions and advice. Coupled with Microsoft’s extensive documentation, blogs, and webinars, users have a multitude of channels to seek help, learn new skills, and troubleshoot issues. This layered approach ensures that businesses of all sizes can find the guidance they need to make the most of Power BI.
Tableau: Charting Your Course With Expert Guides
Tableau takes pride in its customer support and service, offering a wide range of options to suit different needs. Users can access support through multiple channels, including a comprehensive knowledge base, support tickets, and community forums. Tableau also distinguishes itself with Tableau Blueprint, a methodology that guides businesses through the process of becoming data-driven, providing resources for deployment, governance, and scaling.
The Tableau community is particularly noteworthy for its engagement and willingness to help. From Tableau Public, where users share and discuss visualizations, to the Tableau User Groups that meet around the world, there’s a sense of camaraderie and shared purpose that enriches the support experience.
Conclusion
As we bring our navigational journey comparing Microsoft Power BI and Tableau to a close, we’ve traversed through key territories that shape the landscape of data analytics tools. From the integration capabilities that serve as the anchor to our exploration, the user experience and dashboard usability acting as the ship’s wheel, to the scalability and performance ensuring our vessel is sea-worthy. We’ve also examined the pricing structures, akin to provisioning for the voyage, and the invaluable support of a knowledgeable crew through community support and customer service.
READ NEXT:
- Microsoft Power BI vs Segment: The Best Analytics Tool for You
- Microsoft Power BI vs Statcounter: The Best Analytics Tool for You
- Microsoft Power BI vs QlikView: The Best Analytics Tool for You
- Domo vs Zoho Analytics: The Best Analytics Tool for You
- “GoSquared vs Heap: The Best Analytics Tool for You”
- 11 Marketing Analytics Tools to Elevate Your Data-Driven Strategies
- 29+ Digital Analytics Software to Skyrocket Your Digital ROI


Comments are closed.