
In the bustling digital age, where data is as vast as the ocean, choosing the right analytics tool is akin to selecting the best compass for your journey. Among the myriad of options, Microsoft Power BI and SAS Visual Analytics emerge as two leading beacons, each promising to guide businesses through the data deluge to the shores of insight and decision-making. But which one is the true north for your voyage? Whether charting the course for a fledgling startup or navigating the complex currents of a large enterprise, the decision between Power BI and SAS Visual Analytics could set the trajectory for your success. Let’s dive into the crucial area of Integration Capabilities to see which tool might best steer you to the treasures hidden within your data.
| Microsoft Power BI | SAS Visual Analytics |
|---|---|
 |  |
| G2 Score -4.5 out of 5 | G2 Score -4.4 out of 5 |
| TrustRadius Score -8.3 out of 10 | TrustRadius Score -8.4 out of 10 |
User Experience and Dashboard Usability: Steering the Ship with Ease
A tool’s dashboard is the captain’s bridge from where the vast data seas are surveyed; its usability can make or break the voyage of discovery. Here’s how Microsoft Power BI and SAS Visual Analytics chart their courses in providing an engaging and efficient user experience.
Microsoft Power BI: The Compass of Accessibility
Microsoft Power BI is renowned for its intuitive interface and ease of navigation, making it an accessible compass for users of varying skill levels. Its dashboard and report creation tools are designed with a focus on simplicity, incorporating drag-and-drop functionality that encourages exploration and experimentation.
Power BI democratizes data analytics by enabling users to quickly generate visualizations, set up dashboards, and share insights with minimal training. This accessibility extends to its mobile app, allowing users to access data and insights on the go, ensuring that decision-makers are always connected to their navigational charts, regardless of where they are.
SAS Visual Analytics: Charting Complex Waters with Precision
SAS Visual Analytics, while offering a powerful suite of analytics tools, takes a more sophisticated approach to dashboard usability. It is designed for the precise navigation of complex data landscapes, catering to users with a more technical background or those willing to climb the learning curve.
The platform offers advanced visualization capabilities and the flexibility to customize dashboards extensively, providing a detailed map for in-depth data exploration. SAS Visual Analytics excels in environments where the data journey is intricate, requiring detailed analyses and custom reports that answer specific business questions. This makes it a potent tool for data analysts and professionals looking to unlock deep insights.
Pricing Strategies: Navigating the Financial Seas
In the vast ocean of data analytics tools, understanding the pricing model is akin to having a clear map in hand. Let’s delve into how Microsoft Power BI and SAS Visual Analytics structure their pricing, and what it means for businesses plotting their course in the world of data analytics.
Microsoft Power BI: Flexible Tiers for Diverse Journeys
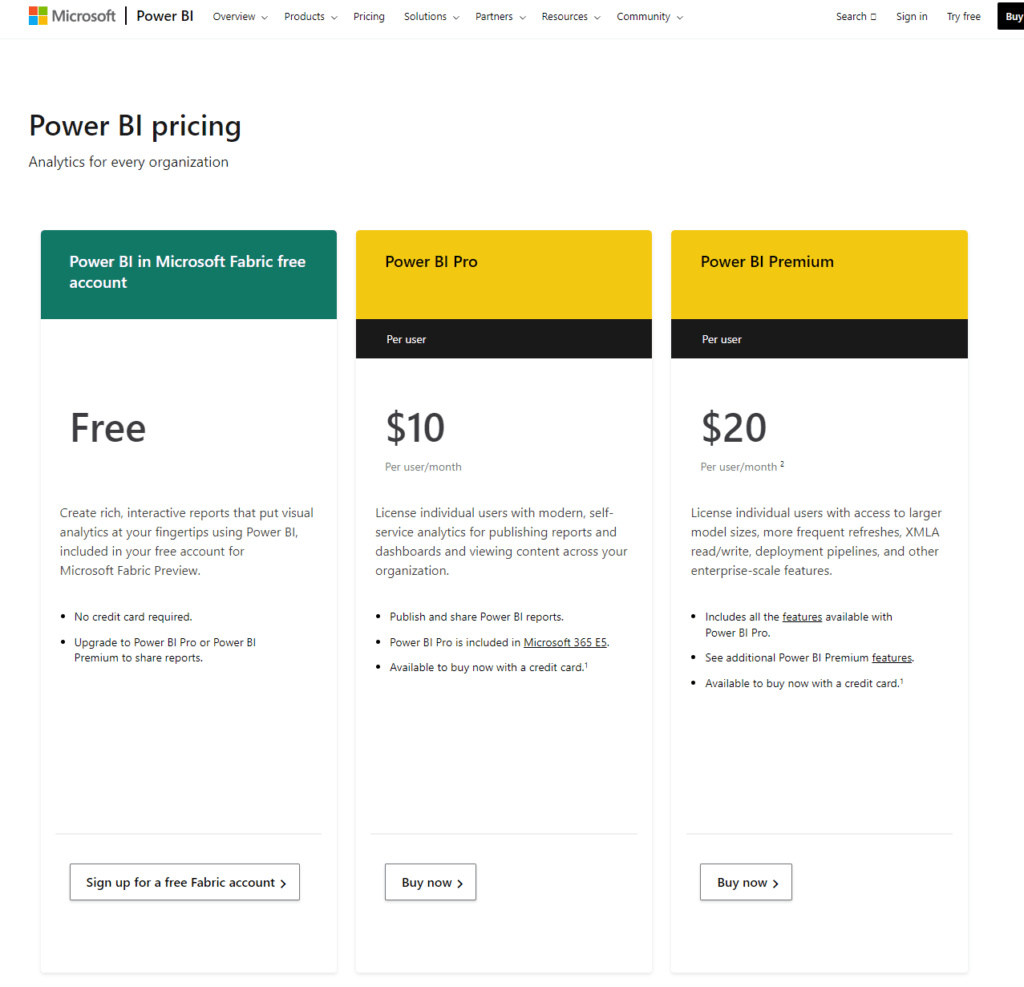
Microsoft Power BI’s pricing model is designed with flexibility in mind, offering several tiers to accommodate businesses of different sizes and needs, this is the free version of Power BI, ideal for individual users or small teams just beginning their analytics voyage. It allows users to create visualizations, reports, and dashboards without any cost.
At a monthly per-user subscription fee, this tier is geared towards professionals and teams that need more collaboration and sharing capabilities. It includes access to cloud services, more frequent data refreshes, and greater storage options. Targeted at larger enterprises, this model is priced on a capacity basis, providing dedicated cloud resources and advanced features. It’s suitable for organizations requiring extensive scalability, performance, and data governance capabilities.
SAS Visual Analytics: Tailored Expeditions for Enterprise Needs
SAS Visual Analytics adopts a more bespoke approach to pricing. Rather than offering fixed tiers, SAS works with organizations to tailor solutions that fit their specific requirements. Pricing can vary widely based on factors such as, Pricing adjustments based on the scale of the user base. Costs can differ whether the solution is hosted on-site, in the SAS Cloud, or in a public cloud environment. The need for advanced analytics, machine learning capabilities, and custom integrations can influence the final pricing.
Integration Capabilities: The Anchor of Your Data Strategy
The ability of an analytics tool to seamlessly integrate with your existing digital infrastructure is like an anchor, holding your insights steady amidst the sea of data. Let’s examine how Microsoft Power BI and SAS Visual Analytics fare in their capacity to connect diverse data sources into a unified analytical framework.
Microsoft Power BI: Charting a Course with Versatility
Microsoft Power BI is designed with a focus on accessibility and versatility, offering extensive integration capabilities across a wide array of data sources, both on-premises and in the cloud. From Excel spreadsheets to complex databases, and even third-party services like Google Analytics and Salesforce, Power BI provides connectors for a multitude of common business applications and services.
This broad integration landscape is further enhanced by Power BI’s ability to leverage Azure services, offering advanced analytics and AI capabilities within the same ecosystem. For businesses navigating a diverse set of software and systems, Power BI acts as a unifying force, bringing disparate data streams into a coherent, interactive dashboard with minimal fuss.
SAS Visual Analytics: Navigating with Precision
SAS Visual Analytics, on the other hand, offers deep integration capabilities tailored to the needs of enterprises with complex data environments. It excels in handling large volumes of data from various sources, providing a robust platform for not only integrating but also analyzing data with precision.
SAS Visual Analytics shines in environments where data is sprawling and varied, offering powerful analytics features that can uncover insights from the depths of big data. With its emphasis on advanced analytics, SAS Visual Analytics is particularly adept at integrating with other SAS solutions, making it a formidable tool for organizations that are already sailing with SAS in their fleet.

Related: Check out our free SEO suite

Advanced Analytics and Reporting Features: The Sextant of Future Voyages
The depth and sophistication of analytics and reporting capabilities can significantly impact your journey, enabling more informed decision-making and strategic foresight. Here’s how Microsoft Power BI and SAS Visual Analytics equip you for these future voyages.
Microsoft Power BI: Democratizing Data Insights
Microsoft Power BI excels in making advanced analytics accessible to a broad audience. Its suite of tools includes easy-to-use features for creating detailed reports, interactive dashboards, and compelling data visualizations. Power BI integrates AI capabilities, offering users predictive analytics and automated insights without needing extensive data science skills.
Features like quick measures, grouping, forecasting, and the integration of Azure Machine Learning allow users to explore future scenarios with ease. This approach empowers businesses of all sizes to harness advanced analytics, making Power BI a versatile companion for those looking to leverage their data for growth and innovation.
SAS Visual Analytics: Navigating Complex Waters with Precision
SAS Visual Analytics is designed for deep dives into the data ocean, offering powerful analytics and reporting features tailored for complex environments. It shines in its ability to handle large datasets, perform intricate analyses, and deliver detailed reporting. SAS Visual Analytics incorporates advanced statistical methods and machine learning algorithms, enabling users to conduct sophisticated predictive analyses, model complex scenarios, and uncover hidden patterns.
This platform is particularly suited for organizations with strong analytical teams ready to tackle the most challenging data seas, providing the tools needed for precise navigation and strategic planning.
Data Privacy and Security: The Armada Protecting Your Fleet
The commitment of an analytics platform to data privacy and security is akin to having a formidable armada protecting your fleet. Here’s how Microsoft Power BI and SAS Visual Analytics fortify their defenses.
Microsoft Power BI: Shielding Your Treasures
Microsoft Power BI benefits from Microsoft’s extensive expertise in cybersecurity, providing a solid foundation for data protection. It employs robust security measures, including data encryption at rest and in transit, to safeguard your information. Power BI adheres to a comprehensive set of compliance standards, ensuring alignment with global data protection regulations such as GDPR, HIPAA, and more.
Its governance features allow administrators to control access meticulously, ensuring only the right eyes survey the data landscape. For businesses navigating the digital seas, Power BI’s security measures act as a vigilant watch, ensuring safe passage through treacherous waters.
SAS Visual Analytics: The Fortified Citadel
SAS Visual Analytics brings SAS’s longstanding reputation for data security to the forefront, offering enterprise-grade protection for your analytics journey. It provides extensive data encryption capabilities, rigorous access controls, and detailed auditing features to track data access and usage.
SAS’s approach to data privacy and security is both comprehensive and customizable, allowing businesses to tailor security settings to meet specific regulatory and organizational needs. For enterprises charting complex data territories, SAS Visual Analytics serves as a fortified citadel, providing peace of mind through stringent security protocols.
Conclusion
As we draw our navigational charts to a close on this exploratory voyage between Microsoft Power BI and SAS Visual Analytics, we’ve traversed through critical territories that shape the landscape of data analytics tools. From the seamless integration capabilities and user-friendly dashboards of Microsoft Power BI to the depth of analytical precision and advanced security measures of SAS Visual Analytics, each tool offers distinct advantages to guide businesses through the complex seas of data.
READ NEXT:
- Hotjar vs Kissmetrics: The Best Analytics Tool for You
- Microsoft Power BI vs QlikView: The Best Analytics Tool for You
- Microsoft Power BI vs Mouseflow: The Best Analytics Tool for You
- Friends+Me vs SmarterQueue: The Best Social Media Management Tool for You
- Hotjar vs Statcounter: The Best Analytics Tool for You
- 11 Marketing Analytics Tools to Elevate Your Data-Driven Strategies
- 29+ Digital Analytics Software to Skyrocket Your Digital ROI