WinSavvy Editorial Standards
How this article was created
In the ever-evolving world of data analytics, choosing the right tool can feel like navigating through a dense fog. On one side, we have Microsoft Power BI, a powerhouse known for transforming raw data into actionable insights. On the other, Optimizely stands out as a beacon for businesses looking to perfect their online experiences through experimentation. Both tools promise to guide you to clearer waters, but which is the right compass for your journey? Let’s dive into the Integration Capabilities to see how these tools measure up, ensuring your vessel is equipped with the best gear for the voyage ahead.
| Microsoft Power BI | Optimizely |
|---|---|
 |  |
| G2 Score -4.5 out of 5 | G2 Score -4.3 out of 5 |
| TrustRadius Score -8.3 out of 10 | TrustRadius Score -8.6 out of 10 |
User Experience and Dashboard Usability: Your Compass and Map
A user-friendly interface and intuitive dashboard are essential for any analytics tool. They ensure that you can find the insights you need swiftly, without getting lost in a maze of data. Let’s see how Microsoft Power BI and Optimizely fare in making the user’s journey through data as smooth as possible.
Microsoft Power BI: Charting a Clear Path
Microsoft Power BI is known for its highly intuitive interface and customizable dashboards, making it accessible for users of varying expertise. It offers a wide array of visualization options, allowing users to create detailed reports and interactive dashboards that illuminate even the most complex datasets.
The platform’s integration with other Microsoft products further enhances its usability, offering a familiar environment for those already versed in tools like Excel and SharePoint. Additionally, Power BI provides extensive training resources and a vibrant community forum, ensuring users have the support they need to navigate the tool successfully.
Optimizely: Steering Through Experiments with Ease
Optimizely, while primarily focusing on A/B testing and digital experimentation, also emphasizes user experience in its dashboard design. It offers a streamlined interface that simplifies the process of creating, managing, and analyzing experiments.
Users can quickly gauge the performance of different variations and make data-driven decisions without needing deep technical knowledge. Optimizely’s focus on delivering clear insights into user behavior and conversion metrics makes it a powerful tool for marketers and product managers looking to optimize their digital experiences.
Integration Capabilities: The Tethers of Your Data Fleet
In the vast sea of analytics, the ability to integrate seamlessly with various data sources and platforms is the lifeline that keeps your fleet together. Here’s how Microsoft Power BI and Optimizely fare in creating a cohesive data ecosystem.
Microsoft Power BI: The Versatile Navigator
Microsoft Power BI is celebrated for its extensive integration capabilities, designed to connect with a myriad of data sources, both on-premises and in the cloud. From SQL databases and Excel spreadsheets to Salesforce and Google Analytics, Power BI ensures that all your data streams can be brought together under one roof.
Its integration extends to Microsoft’s suite of products, offering a familiar and seamless experience for users entrenched in the Microsoft ecosystem. For organizations navigating through diverse data landscapes, Power BI acts as a unifying force, adeptly bringing isolated data islands into a comprehensive map for exploration.
Optimizely: Master of Digital Experimentation Seas
Optimizely, while primarily known for its A/B testing and experimentation capabilities, also offers integration features that focus on enhancing the digital experience. It integrates with content management systems, analytics platforms, and even CRM solutions, ensuring that insights from experiments are easily accessible and actionable within your broader data strategy.
Though not as broad in scope as Power BI’s integrations, Optimizely’s targeted approach allows for deep dives into how changes affect user behavior and conversion rates, making it a vital tool for businesses focused on optimizing their digital presence.
Pricing: Charting the Financial Waters
The cost of embarking with an analytics tool is a critical consideration that can sway your decision. It’s vital to navigate these waters with a clear understanding of each platform’s pricing structure and the value it delivers. Let’s compare the pricing models of Microsoft Power BI and Optimizely to see which might offer the best value for your journey.
Microsoft Power BI: Flexible Sails for Various Voyages

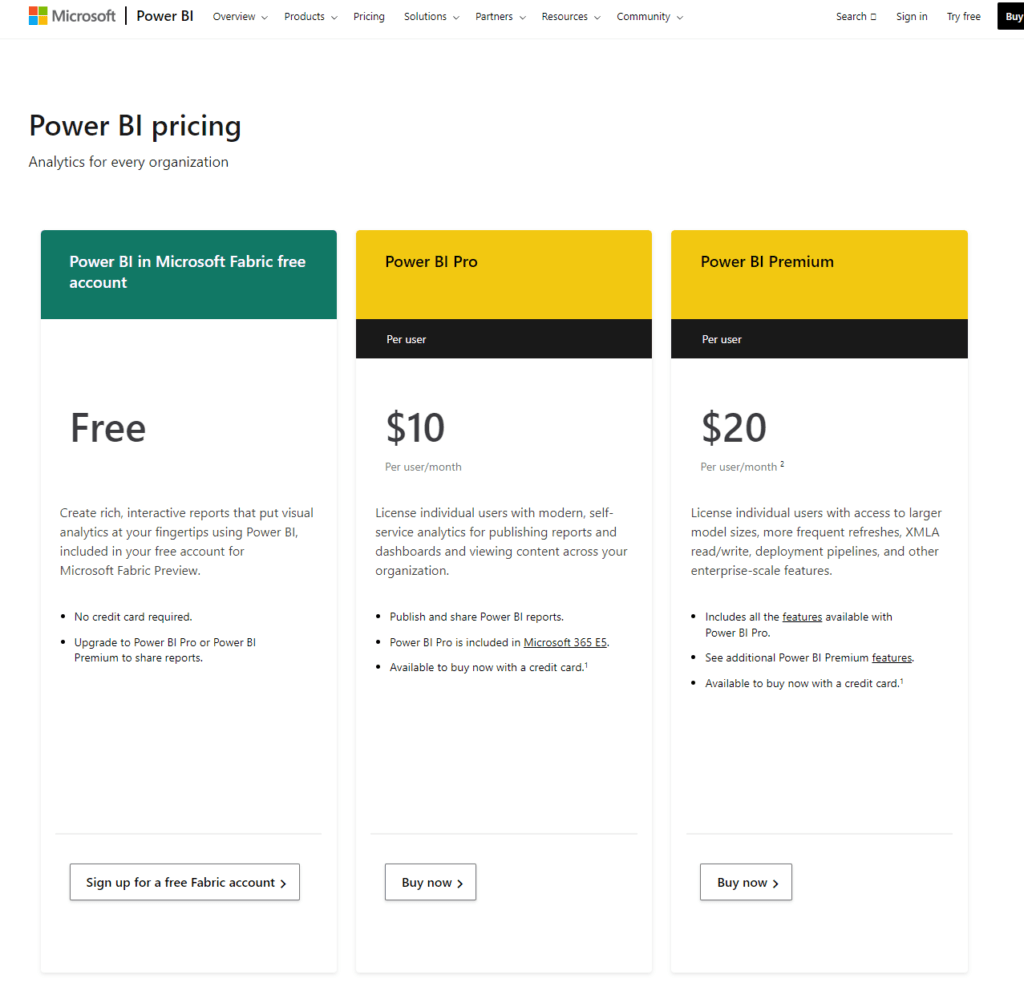
Microsoft Power BI offers a tiered pricing model designed to accommodate a range of needs, from individual adventurers to large enterprise fleets, this free version allows individuals to start analyzing and visualizing their data without any cost, perfect for solo data explorers or small teams beginning their journey.
At $9.99 per user per month, this plan is designed for professionals and teams needing collaboration features, app publishing, and more frequent data refreshes. It’s a cost-effective entry for small to medium-sized businesses or departments within larger organizations looking to share insights and collaborate on data analysis.
With pricing starting at $4,995 per month for a dedicated cloud compute and storage resource, Premium caters to large enterprises requiring advanced analytics, governance, and scalability features. This option also includes a per user pricing model, making it accessible to businesses of various sizes looking for premium capabilities.
Optimizely: Tailored Pricing for Digital Experimentation

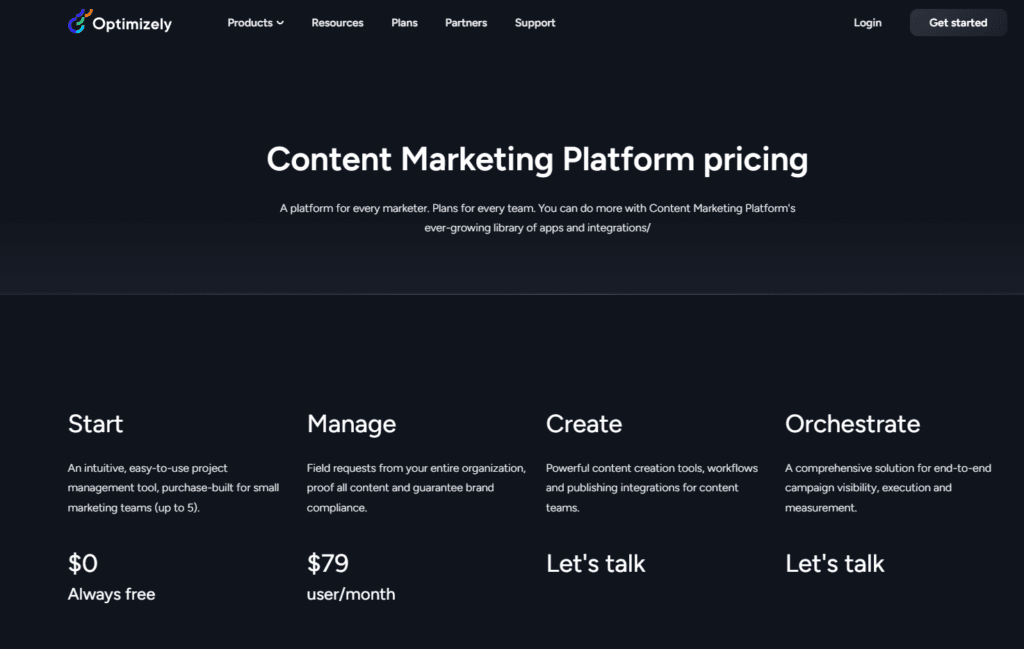
Optimizely’s pricing structure is tailored to support businesses focused on experimentation and optimization, with details often provided upon request to align with specific needs. Pricing for Optimizely’s web experimentation platform is not publicly listed and varies based on the scale of usage and specific requirements.
Interested businesses need to contact Optimizely directly for a customized quote, which allows for a pricing structure that aligns with the scope of their experimentation programs. Similar to its web experimentation offering, Optimizely Full Stack pricing is customized based on the needs of the business, including the number of experiments, feature flags, and level of support required.
Scalability and Performance: Navigating Expansive Seas
Scalability and performance in the realm of analytics tools are like the sails and rudder of your ship, determining how swiftly and effectively you can move forward. Let’s assess how Microsoft Power BI and Optimizely ensure your voyage remains unhampered by growing data volumes or complexity.
Microsoft Power BI: The Sturdy Galleon
Microsoft Power BI showcases its strength through its robust scalability and high performance. Engineered on the powerful backbone of Microsoft’s cloud infrastructure, it ensures that organizations can scale their analytics operations seamlessly, from small teams to enterprise levels.
Power BI’s performance remains consistent even as the datasets grow, thanks to its efficient data modeling and processing capabilities. For businesses charting courses through vast data oceans, Power BI stands as a reliable vessel, equipped to handle increasing analytics demands without sacrificing speed or clarity.
Optimizely: The Agile Clipper
Optimizely, with its keen focus on experimentation and optimization, offers a different kind of scalability. It’s designed to perform optimally in the specific context of A/B testing, personalization, and user experience optimization. While it may not face the same broad scalability challenges as a comprehensive BI tool like Power BI, Optimizely excels in scaling its performance for digital experiments.
This makes it a vital ally for businesses focused on enhancing their digital platforms, ensuring that user experience insights remain accurate and actionable, no matter the volume of traffic or the complexity of the experiments.

Related: Check out our free SEO suite

Customer Support and Service: The Crew That Keeps You Afloat
The availability and quality of customer support and service are akin to having experienced sailors and navigators by your side. Let’s examine how Microsoft Power BI and Optimizely ensure their users are well-supported throughout their journey.
Microsoft Power BI: A Vast Armada of Support
Microsoft Power BI benefits from Microsoft’s extensive support infrastructure, offering a range of support options designed to meet various needs, Power BI’s user community is a treasure trove of knowledge, where users can exchange insights, find solutions, and share experiences.
An extensive library of documentation, tutorials, and online courses is available, providing users with self-help options to learn and troubleshoot. For more immediate or complex issues, Microsoft offers direct support through its Power BI Pro and Premium plans, ensuring businesses can access expert help when needed. This multi-tiered approach ensures users have access to the right level of support, from peer advice to expert assistance.
Optimizely: Navigating With Dedicated Guides
Optimizely offers a focused approach to customer support, recognizing the importance of timely and effective assistance in running experiments and optimizing digital experiences, Optimizely provides users with access to a comprehensive knowledge base and Optimizely Academy, offering tutorials and resources tailored to experimentation and optimization.
Its active community forum allows users to seek advice, share best practices, and learn from the collective experience of other Optimizely users. For more personalized assistance, Optimizely offers professional services and dedicated support, especially valuable for enterprises or complex experimentation programs. Optimizely’s support ecosystem is designed to ensure that businesses can confidently test, learn, and iterate on their digital platforms.
Customization: Crafting Your Analytics Compass
The extent to which an analytics tool can be customized influences its utility and effectiveness, shaping it to the contours of your business landscape. Let’s explore how Microsoft Power BI and Optimizely adapt to the customization winds.
Microsoft Power BI: The Versatile Craft
Microsoft Power BI stands out for its high degree of customization, offering users the ability to tailor almost every aspect of their data analytics journey, Beyond its extensive library of visualization types, Power BI allows users to create or import custom visuals, ensuring that every data story can be told in the most impactful way. Users have complete control over the design and layout of reports and dashboards, enabling the creation of bespoke analytics environments that cater precisely to their needs.
Power BI provides advanced data modeling capabilities, allowing users to define custom measures and dimensions, integrate data from multiple sources, and manipulate it to reveal deeper insights. With support for a wide range of third-party services and applications, Power BI can be extended and integrated into existing business systems, enhancing its functionality and utility.
Optimizely: The Tailored Explorer
Optimizely, focusing on experimentation and optimization, offers customization features that empower users to fine-tune their digital experiments, Users can customize every aspect of their experiments, from the variables tested to the segmentation of audience groups, ensuring that each test is precisely aligned with business hypotheses. Optimizely can be customized to integrate seamlessly with other analytics platforms, allowing for deeper insights into the impact of experiments on user behavior and business outcomes.
Beyond A/B testing, Optimizely enables the customization of user experiences through targeted personalization, allowing businesses to tailor their digital properties to the preferences and behaviors of different user segments. Optimizely offers a range of APIs and SDKs, enabling developers to build custom solutions and integrations, extending the platform’s capabilities to meet specific business requirements.
Conclusion
Our comparative journey may have reached its harbor, but the sea of data analytics and optimization is ever-expanding. As new technologies emerge and the digital landscape evolves, staying informed and adaptable will be key to navigating the future successfully. May the insights gathered on this voyage illuminate your path, guiding you to the analytics tool that best aligns with your strategic goals and empowers your organization to harness the winds of data, steering you toward new horizons of success and discovery.
READ NEXT:
- IBM Cognos Analytics vs MicroStrategy: The Best Analytics Tool for You
- Microsoft Power BI vs HubSpot Marketing Analytics: The Best Analytics Tool for You
- Microsoft Power BI vs Segment: The Best Analytics Tool for You
- Hotjar vs Kissmetrics: The Best Analytics Tool for You
- Hotjar vs HubSpot Marketing Analytics: The Best Analytics Tool for You
- 11 Marketing Analytics Tools to Elevate Your Data-Driven Strategies
- 29+ Digital Analytics Software to Skyrocket Your Digital ROI


Comments are closed.