
In the bustling marketplace of data analytics tools, where choices abound and the paths seem endless, two giants stand out, each promising to guide businesses to the treasure trove of insights they seek: Microsoft Power BI and Looker. Navigating through the dense fog of features, capabilities, and technical jargon can feel like an odyssey in itself. So, how do you choose the compass that will truly lead you to success? In this exploration, we’ll dive into the Integration Capabilities of these two platforms, a critical factor that could chart the course for your data-driven journey.
| Microsoft Power BI | Looker |
|---|---|
 | |
| G2 Score -4.5 out of 5 | G2 Score -4.4 out of 5 |
| TrustRadius Score -8.3 out of 10 | TrustRadius Score -8.0 out of 10 |
Integration Capabilities: The Lifelines of Data Analytics
In the vast ocean of business intelligence, the ability to seamlessly connect with various data sources and platforms is not just a convenience—it’s a lifeline. Here’s how Microsoft Power BI and Looker fare in their quest to integrate the scattered islands of data into a coherent, navigable map.
Microsoft Power BI: A Versatile Explorer
Microsoft Power BI is renowned for its extensive integration capabilities, designed to connect with a wide array of data sources, both on-premises and in the cloud. From traditional databases and Excel spreadsheets to modern cloud services like Azure, Salesforce, and Google Analytics, Power BI ensures that businesses can gather their disparate data streams into a single, cohesive analytical view.
This broad horizon of connectivity is further enhanced by Power BI’s adaptability to Microsoft’s ecosystem, offering advanced analytics and AI capabilities. For organizations charting courses through diverse data landscapes, Power BI acts as a unifying force, adeptly bringing isolated data islands into comprehensive maps for exploration.
Looker: The Precision Navigator
Looker takes a slightly different tack, focusing on providing deep integration through its powerful LookML modeling language. This approach allows for the creation of a centralized data model that serves as a single source of truth, ensuring consistency and reliability across the organization.
Looker integrates seamlessly with a variety of SQL-based databases and cloud storage solutions, transforming raw data into a structured, queryable format that’s ready for analysis. While it may not boast the same breadth of direct connectors as Power BI, Looker’s method offers precision and depth, ensuring that data from various sources can be accurately represented and explored.
Pricing: Navigating the Financial Waters
Understanding the pricing structures of Microsoft Power BI and Looker is essential for making an informed decision that aligns with your organization’s financial and analytical needs. Let’s compare how these two platforms set their sails in terms of cost.
Microsoft Power BI: Flexible Pricing for Diverse Needs
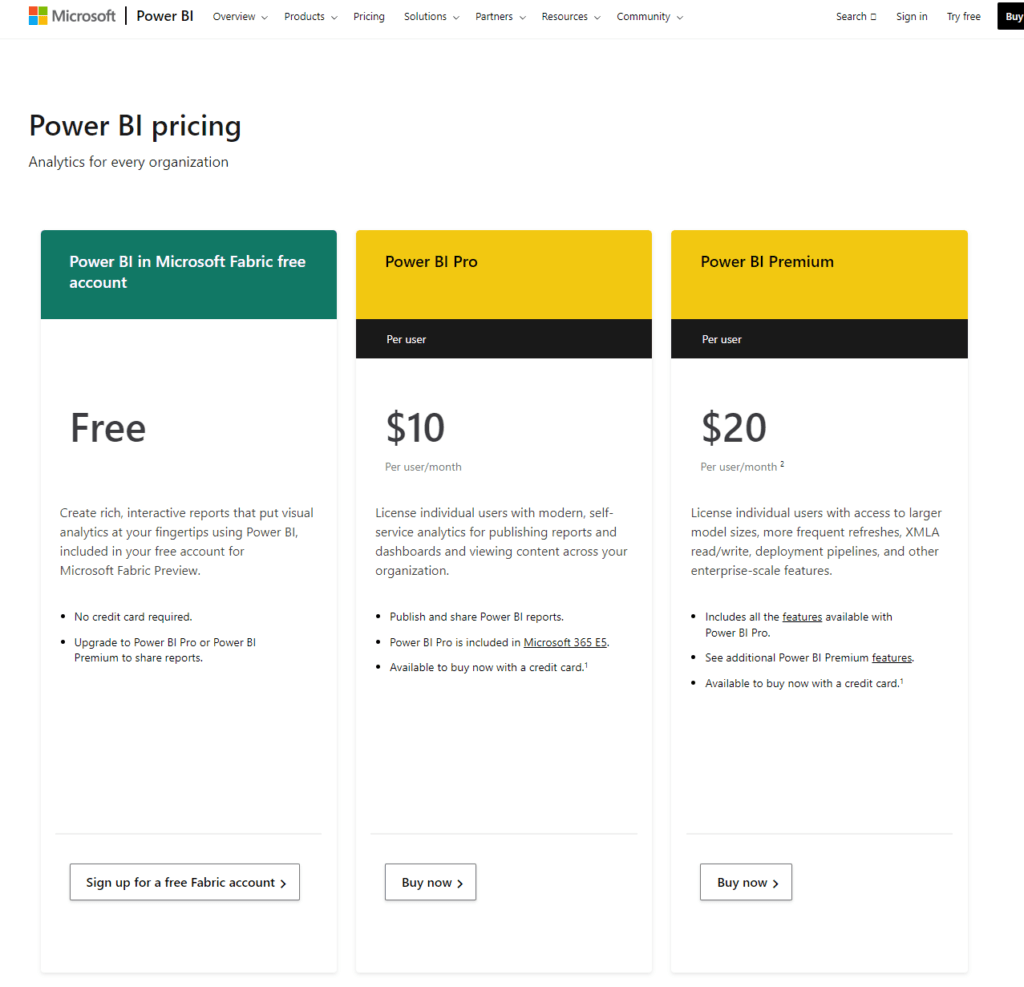
Microsoft Power BI offers a tiered pricing model designed to accommodate a range of users and organizational sizes, this is a free version suitable for individual users or small teams just starting their analytics journey, offering robust data visualization and basic analytics capabilities.
Priced at approximately $9.99 per user per month, this plan is aimed at professionals and teams needing advanced collaboration features, more frequent data refreshes, and larger data volumes. Available in two forms: per user (starting around $20 per user per month) and per capacity (starting at $4,995 per month), catering to large enterprises requiring dedicated cloud resources, advanced analytics, and big data capabilities.
Looker: Custom Pricing for Tailored Solutions

Looker adopts a custom pricing model, which can vary widely based on the specific needs and scale of use within an organization, Looker’s approach to pricing requires potential users to contact their sales team for a quote. This pricing model is based on factors such as the number of users, the scale of data being processed, and the specific features and support options required.
Though specific prices aren’t listed, Looker’s custom pricing strategy is designed to ensure businesses of all sizes can find a package that fits their needs, focusing on providing a scalable solution that grows with your company.
User Experience and Dashboard Usability: The Compass for Your Data Exploration
The design of an analytics tool’s interface and the usability of its dashboards are crucial for ensuring that insights are not only accessible but also actionable. Here’s how Microsoft Power BI and Looker fare in guiding users through their data exploration journey.
Microsoft Power BI: Charting a Course with Clarity
Microsoft Power BI is lauded for its intuitive design, making complex data analysis accessible to users at all levels of expertise. With a drag-and-drop functionality and a wide array of visualization options, users can easily create reports and interactive dashboards that not only look appealing but are also rich in insights.
The integration with other Microsoft products enhances its usability, offering a familiar environment for those already versed in the Microsoft ecosystem. Power BI also places a strong emphasis on collaboration, making it easier for teams to share insights and make data-driven decisions together.
Looker: Navigating Data with Precision
Looker offers a unique approach to user experience and dashboard usability, emphasizing the power of data modeling through its LookML language. This might present a steeper learning curve for new users, but it pays off in the customization and depth of analysis it enables.
Looker’s dashboards are highly customizable, allowing users to tailor their data exploration experience precisely to their needs. The platform also excels in embedding analytics into operational workflows, thereby not just presenting data but integrating insights seamlessly into business processes.
Data Modeling and Management: Building the Keel of Your Analytics Vessel
Data modeling and management capabilities are crucial for ensuring that your analytics platform not only supports your current data strategies but is also adaptable to future changes in the data landscape. Let’s see how Microsoft Power BI and Looker structure their offerings to support complex data modeling and efficient data management.
Microsoft Power BI: The Adaptable Brigantine
Microsoft Power BI offers robust data modeling features that cater to a wide range of analytics needs. Its Power Query tool is a standout, providing users with intuitive data preparation capabilities that simplify the process of cleaning and transforming data.
Power BI’s data modeling environment supports the creation of complex relationships, custom calculations, and measures using DAX (Data Analysis Expressions). This flexibility makes Power BI not just a tool for visualizing data but also a powerful platform for constructing sophisticated data models that can illuminate hidden insights.
Looker: The Caravel Built for Exploration
Looker’s approach to data modeling and management is centered around its LookML modeling language. LookML offers a unique and powerful way for users to define data relationships, calculations, and aggregations directly within the platform, ensuring that everyone in the organization works from a single source of truth.
This methodology promotes a high level of data governance and consistency across all analytics outputs. While LookML requires a learning curve, the depth of customization and precision it offers makes Looker an exceptionally strong tool for businesses that prioritize data accuracy and a unified data model in their analytics practices.

Related: Check out our free SEO suite

Collaboration and Sharing: Sailing Together Towards Insights
The features that support collaboration and sharing within an analytics platform can significantly impact an organization’s ability to act on data-driven insights. Let’s examine how Microsoft Power BI and Looker facilitate teamwork and information dissemination.
Microsoft Power BI: The Collaborative Armada
Microsoft Power BI excels in collaboration and sharing, thanks in part to its seamless integration with the Microsoft 365 suite. This integration allows users to, easily with colleagues within the same organization, ensuring that insights are accessible to those who need them.
Through integration with Microsoft Teams and SharePoint, enabling discussions and decisions based on the latest data. Using the Power BI service, making insights available to a broader audience while controlling access and editing permissions. These features make Power BI a formidable tool for organizations that rely heavily on collaboration and wish to integrate their data analytics seamlessly within their existing Microsoft ecosystem.
Looker: The Unified Fleet
Looker promotes collaboration through its centralized data modeling and shared dashboards, emphasizing consistency and accuracy across all users. It enables teams to, Across the organization, ensuring that different departments have access to tailored insights relevant to their specific needs.
In other applications and websites, extending the reach of data insights beyond the Looker platform. Precisely, thanks to its role-based access controls, which ensure that sensitive data is protected while still promoting data-driven decision-making across the organization. Looker’s approach to collaboration is built around the idea of fostering a data culture where everyone operates from a single source of truth, supported by accurate and consistent data models.
Data Security and Compliance: The Bulwarks of Your Analytics Fleet
The strength of an analytics platform’s security features and its adherence to global compliance standards are critical for protecting your data treasure. Let’s navigate through how Microsoft Power BI and Looker ensure the safety and integrity of your analytics endeavors.
Microsoft Power BI: The Fortified Galleon
Microsoft Power BI benefits from Microsoft’s extensive experience in cybersecurity, incorporating robust security features designed to protect your data, Power BI ensures data is encrypted both at rest and in transit, safeguarding your information from unauthorized access.
Power BI adheres to a comprehensive suite of global compliance standards, including GDPR, HIPAA, and SOC 2, ensuring that your data analytics practices meet rigorous regulatory requirements. With Azure Active Directory integration, Power BI offers fine-grained access controls, enabling you to specify exactly who can view and interact with your reports and dashboards, enhancing data governance and privacy.
Looker: The Agile Security Schooner
Looker, now part of Google Cloud, leverages Google’s formidable security infrastructure to protect its users’ data, similar to Power BI, Looker encrypts data at rest and in transit, providing a high level of security for your analytics data.
Looker inherits Google Cloud’s adherence to key compliance and security standards, including GDPR, HIPAA, and SOC 2, ensuring that it meets the needs of enterprises concerned with data compliance. Looker offers detailed permission settings and access controls, allowing organizations to finely tune who has access to specific data and insights, thereby safeguarding sensitive information.
Conclusion
Our comparative journey may have reached its conclusion, but the sea of data analytics is ever-expanding. As new technologies emerge and the digital landscape evolves, the key to successful navigation will be staying informed, adaptable, and ready to embrace new opportunities for growth and insight. May the insights gathered on this voyage illuminate your path, guiding you to the analytics tool that best aligns with your strategic goals and empowers your organization to harness the winds of data, steering you toward new horizons of success and discovery.
READ NEXT:
- Microsoft Power BI vs Optimizely: The Best Analytics Tool for You
- IBM Cognos Analytics vs Microsoft Power BI: The Best Analytics Tool for You
- Microsoft Power BI vs Statcounter: The Best Analytics Tool for You
- Microsoft Power BI vs Mouseflow: The Best Analytics Tool for You
- 19 Best Marketing Automation Tools for e-Commerce: A Deep Dive!
- 11 Marketing Analytics Tools to Elevate Your Data-Driven Strategies
- 29+ Digital Analytics Software to Skyrocket Your Digital ROI


Comments are closed.