
Choosing between Hotjar and Microsoft Power BI is like deciding between a telescope and a microscope. Both are powerful tools for observation, but they serve different purposes. Hotjar lets you zoom in on your website’s user experience with the precision of a microscope, while Power BI allows you to gaze at the vast universe of your business data through a telescope. If you’re wrestling with the decision of which analytics tool is the best fit for your needs, you’re in the right place. Let’s dive into the key differences and find out which tool will best illuminate your path to data-driven success.
| Hotjar | Microsoft Power BI |
|---|---|
 |  |
| G2 Score – 4.3 out of 5 stars | G2 Score – 4.5 out of 5 stars |
| TrustRadius Score – 8.2/10 | TrustRadius Score – 8.3/10 |
User Experience Insights vs Data Visualization Mastery
Understanding Your Users with Hotjar
When it comes to understanding how users interact with your website, few tools are as insightful as Hotjar. It’s like having a GPS tracker on every visitor, showing you exactly where they go, what catches their attention, and where they get lost. The heatmaps feature is a game-changer, transforming cold, hard data into vibrant, color-coded maps that let you see your website through your users’ eyes. You can literally watch the warm trails of mouse movements and clicks, highlighting the hot spots of engagement and the cold zones that might need a bit of warming up.
But Hotjar isn’t just about watching from afar; it invites you into the user’s experience. Through session recordings, you can play back the exact journey a user took through your site, observing every click, scroll, and moment of hesitation. It’s like a reality show featuring your website, providing unscripted insights into user behavior that you can’t get from numbers alone.
And when you’re ready to ask your audience directly, Hotjar’s feedback polls and surveys come into play. These tools are your microphone to the crowd, allowing you to gather candid user feedback that can guide your website improvements. Whether it’s a question about usability or satisfaction, Hotjar gives you the means to hear directly from those who matter most—your users.
Power BI: The Art of Data Storytelling
Microsoft Power BI, on the other hand, turns you into a data storyteller. It’s not just about presenting numbers; it’s about weaving those numbers into a narrative that can drive strategic decisions. Power BI excels in data visualization, offering a plethora of charts, graphs, and dashboards that turn your data into a compelling story.
With Power BI, the strength lies in its ability to connect to a vast array of data sources, from Excel spreadsheets to cloud services and beyond. This connectivity means you can gather data from different facets of your business and bring it all into one coherent picture. It’s like being the director of a film where every department’s data is a scene contributing to the overall story of your business’s performance.
Customization is where Power BI really shines. You can tailor your dashboards and reports to highlight the metrics that matter most, ensuring that key stakeholders can quickly grasp the health and direction of the business. And with the power of AI-driven insights, Power BI doesn’t just report on the past; it helps predict future trends, giving you a roadmap for strategic planning.
Customization and Flexibility
Tailoring Tools to Your Needs
Hotjar: User-Centric Customization
Hotjar’s approach to customization is deeply rooted in enhancing the user experience on your website. Its flexibility lies in how you can set up heatmaps, session recordings, and feedback tools to focus on specific pages, events, or user actions. This targeted approach allows you to customize your analytics to gather the most relevant insights for your current projects or objectives.
For instance, if you’re rolling out a new product page, Hotjar enables you to specifically monitor how users interact with this page. You can customize heatmaps to see where users click the most or don’t click at all, providing clear guidance on what elements are working and which ones need tweaking. Similarly, session recordings can be filtered to focus on visits to this new page, giving you a front-row seat to the user’s experience.
The feedback tools in Hotjar, like surveys and polls, offer another layer of customization. You can tailor questions based on specific user actions or page visits, ensuring that the feedback you receive is directly related to the areas you’re most interested in improving. This level of customization makes Hotjar an incredibly flexible tool for those focused on refining the user experience.
Microsoft Power BI: Customization at Scale
Microsoft Power BI offers customization on a grand scale, allowing you to create dashboards and reports that precisely meet your business’s analytical needs. The tool’s flexibility comes from its powerful data modeling capabilities, which enable you to transform raw data into the exact format you need for your analyses.
With Power BI, you can connect to multiple data sources, both internal and external, and customize how this data is presented. You have the freedom to design reports with complex metrics that matter most to your stakeholders, using a wide array of visualization options to bring your data to life. The ability to create custom visualizations means you’re not limited to standard charts and graphs; you can design visuals that resonate with your audience and clearly communicate the insights you’ve uncovered.
Furthermore, Power BI’s dashboards are fully interactive, allowing users to drill down into the data for deeper analysis. This level of interactivity is customizable, enabling you to control which data points can be explored further and how. This customization extends to the sharing and collaboration features, allowing you to tailor the accessibility of your reports and dashboards to different teams or stakeholders within your organization.
Data Collection and Processing Capabilities
The Foundation of Insightful Analytics
Hotjar: Qualitative Insights from Direct User Interactions
Hotjar specializes in collecting qualitative data that offers a window into the user’s experience on your website. Unlike traditional analytics platforms that focus on quantitative data like page views, session lengths, and bounce rates, Hotjar emphasizes the “why” behind user actions. This approach to data collection is invaluable for businesses looking to improve website usability, enhance customer satisfaction, and increase conversions.
The strength of Hotjar lies in its ability to capture and process data directly from user interactions. Heatmaps provide visual representations of where users click, scroll, and move on your pages, while session recordings offer a play-by-play of real user journeys through your site. This direct observation method allows you to see your website through your users’ eyes, identifying pain points, obstacles, and opportunities for improvement.
Feedback tools like surveys and polls are another vital component of Hotjar’s data collection capabilities. These tools enable you to collect qualitative feedback directly from your users, offering insights into their needs, preferences, and frustrations. This direct line of communication with your audience supplements the behavioral data collected through heatmaps and recordings, providing a well-rounded understanding of the user experience.
Microsoft Power BI: Quantitative Analysis at Scale
Microsoft Power BI, in contrast, excels in collecting, processing, and analyzing quantitative data from a wide variety of sources. It is designed for businesses that require comprehensive analytics across multiple data points to inform strategic decision-making. Power BI’s data processing capabilities are robust, allowing it to handle large volumes of data efficiently and provide real-time insights.
The platform’s ability to connect to numerous data sources, including cloud services, on-premise databases, and Excel spreadsheets, makes it a versatile tool for data collection. This connectivity ensures that you can aggregate data from different aspects of your business, from sales and marketing to operations and finance, into a single, coherent analytical platform.
Power BI’s data modeling features are particularly powerful, enabling you to transform raw data into actionable insights. You can create custom calculations, measures, and data relationships, tailoring the analysis to meet your specific business needs. This level of control over data processing allows for sophisticated analyses, such as trend forecasting, market segmentation, and performance benchmarking.

Related: Check out our free SEO suite

Data Integration and Accessibility
Streamlining Your Data Ecosystem
Hotjar: Focused Integration for Enhanced User Insights
Hotjar’s approach to data integration primarily supports its core mission: providing clear, actionable insights into user behavior on websites and web applications. It specializes in capturing direct feedback and visualizing user interactions, which means its integration capabilities are designed to enhance these functions.
Integration with website and e-commerce platforms is straightforward with Hotjar. By inserting a simple tracking code, you can start collecting data almost immediately. This ease of integration ensures that Hotjar can work harmoniously with your existing website infrastructure, making it an accessible tool for marketers, UX designers, and product managers who may not have deep technical expertise.
While Hotjar might not offer the extensive data source integration capabilities seen in more comprehensive business intelligence tools, it does excel in its niche. For businesses focused on understanding and improving the digital customer journey, Hotjar’s ability to integrate user feedback and behavior data into the broader analytics landscape can be invaluable. This focused integration allows teams to quickly act on user insights, streamline user experience improvements, and monitor the impact of changes in real-time.
Microsoft Power BI: Comprehensive Data Integration for Business Intelligence
Microsoft Power BI stands out for its robust data integration capabilities, designed to cater to the complex needs of businesses navigating vast data landscapes. Power BI excels in pulling together data from a wide variety of sources, including cloud services, databases, Excel files, and even third-party SaaS applications. This wide-ranging compatibility is a cornerstone of Power BI’s appeal, offering businesses a unified view of their operations, finance, sales, and customer data all in one platform.
The strength of Power BI lies in its ability to not only aggregate data from these diverse sources but also to refresh this data in real-time or on a scheduled basis. This ensures that decision-makers have access to the most current insights possible, making it easier to spot trends, identify opportunities, and respond to challenges promptly.
Moreover, Power BI’s integration extends into the Microsoft ecosystem, offering seamless connections with tools like Excel, Azure, and Dynamics 365. This integration enhances productivity and collaboration, allowing teams to work within a familiar environment while leveraging powerful analytics and reporting capabilities. For organizations already invested in Microsoft products, this can streamline workflows and enhance data accessibility across the board.
Pricing
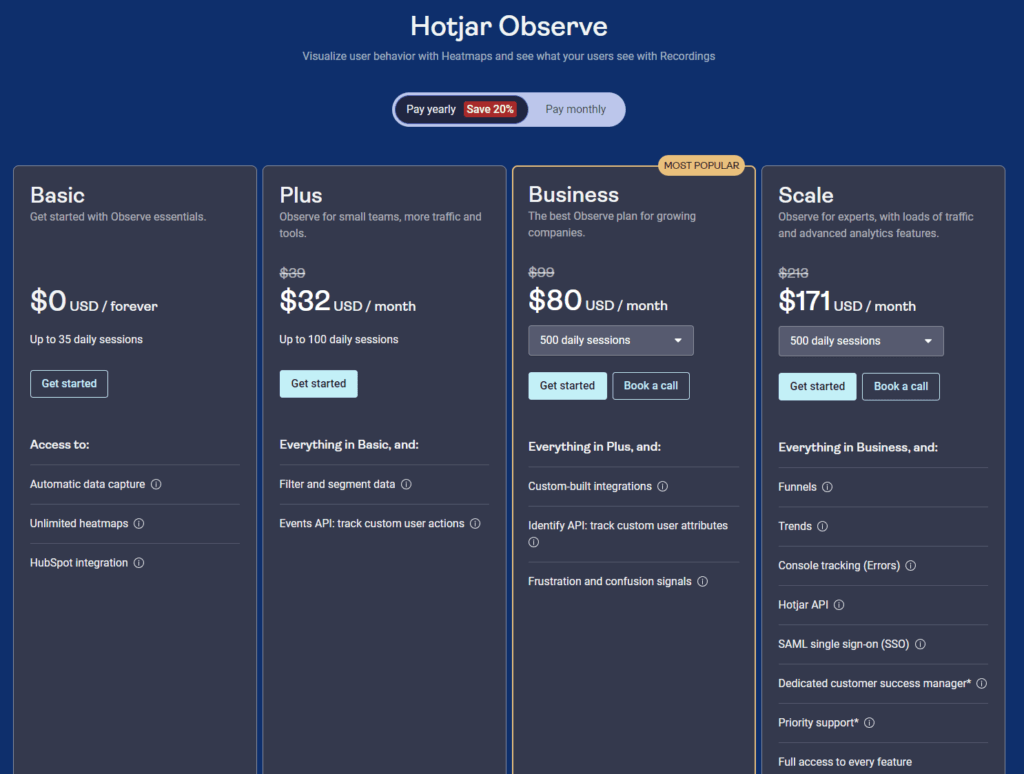
Hotjar
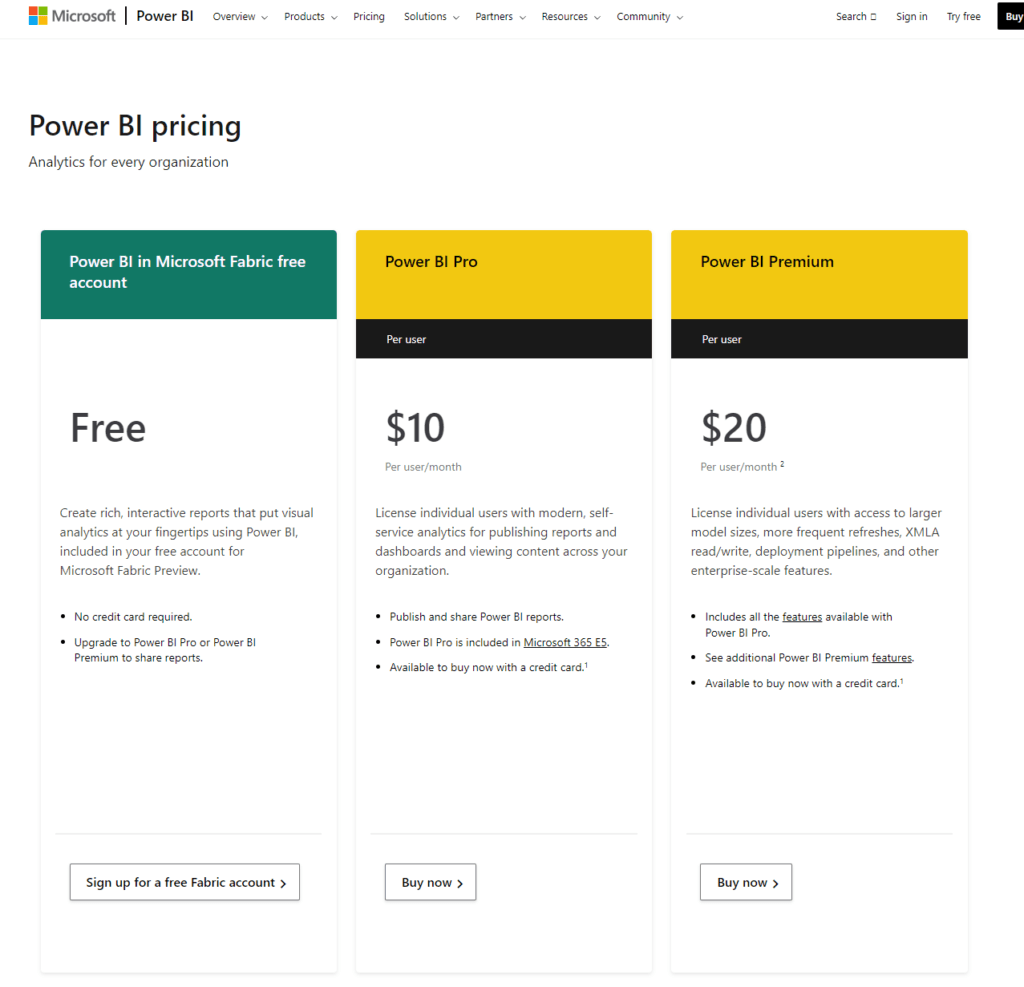
Power BI
Conclusion
Hotjar, with its intuitive interface and focus on user behavior, is like a high-powered microscope. It allows businesses to zoom in on the intricacies of how users interact with their websites, offering insights that are vital for optimizing user experience and enhancing website performance. It’s the tool of choice for those who wish to walk in their users’ shoes, understand their pain points, and tailor their digital spaces to meet user needs more effectively.
On the other hand, Microsoft Power BI serves as a powerful telescope, bringing into focus the vast universe of business data. With its robust data integration capabilities and comprehensive reporting and analytics features, Power BI is designed for businesses that need to consolidate data from various sources to make informed strategic decisions. It offers a bird’s-eye view of business operations, empowering organizations to navigate the complexities of their data and uncover actionable insights that drive growth and innovation.
Read Next:
- How to Use Multi-channel Marketing for Lead Engagement
- How to Utilize Retargeting for Email Engagement
- How to Use Email Automation Tools: Our Take
- How to use GetResponse: An Explainer!
- 31+ Top Social Media Management tools Compared! (2023)


Comments are closed.