
Embarking on the digital journey to unearth the right analytics tool for your needs, you’ll find the waters brimming with options. Among the myriad, Crazy Egg and SAS Visual Analytics emerge as two leading beacons, each illuminating a path through the data-driven landscape. But which beacon should you steer towards? The choice isn’t just about selecting a tool; it’s about finding an ally that resonates with your digital voyage’s scale, ambitions, and the insights you seek to discover.
| Crazy Egg | SAS Visual Analytics |
|---|---|
| G2 Score – 4.2 out of 5 stars | G2 Score – 4.4 out of 5 stars |
| TrustRadius Score – 7.6/10 | TrustRadius Score – 8.4/10 |
Navigating Ease of Use and User Experience
In the realm of digital analytics, where the seas of data are vast and sometimes turbulent, the ease of use and user experience (UX) of an analytics tool is akin to having a sturdy, reliable compass. It’s essential for ensuring that you can navigate these waters effectively, without getting lost in a maelic of complexity.
Crazy Egg: The Intuitive Cartographer
Crazy Egg shines as an intuitive cartographer, mapping user behavior on your website with tools designed for clarity and simplicity. Its platform is built around the concept of visual analytics, with heatmaps, scroll maps, and other visual tools that allow you to quickly understand how visitors interact with your site. This approach to analytics demystifies user data, making it accessible to not just data scientists but to marketers, content creators, and business owners alike. Crazy Egg’s user-friendly dashboard and straightforward reporting tools make it a favored compass for small to medium-sized businesses venturing into the analytics seas for the first time or those who value quick insights to guide immediate actions.
SAS Visual Analytics: The Seasoned Navigator
In contrast, SAS Visual Analytics stands as the seasoned navigator, equipped with a sophisticated set of tools for deep data exploration and analysis. Its comprehensive platform offers advanced analytics capabilities, including predictive analytics, machine learning, and complex data visualization, all designed to help you chart intricate patterns in user behavior and business performance.
The depth of SAS Visual Analytics’ features brings unparalleled insights but requires a steadier hand at the helm, with a steeper learning curve that may be more suited to enterprises and organizations with dedicated data analysis teams. Its powerful analytics engine allows for a detailed dissection of data, making it possible to steer through the most complex digital waters and uncover insights that can fundamentally shape strategic decisions.
Data Visualization and Reporting: The Constellations of Insight
In the vast expanse of digital analytics, the ability to not only see but also understand and act upon the data is akin to navigating by the stars. The tools that enable us to visualize complex information in an understandable and actionable manner are invaluable. Let’s explore how Crazy Egg and SAS Visual Analytics illuminate the data landscape, helping us chart our course.
Crazy Egg: The Spyglass to User Behavior
Crazy Egg serves as a powerful spyglass, bringing into focus the immediate actions and behaviors of users on your site. Its data visualization tools, particularly heatmaps, scroll maps, and confetti, transform raw data into vibrant, color-coded maps of user interaction. This visualization approach makes it exceedingly accessible for businesses to pinpoint areas of their website that engage users the most and those that may cause confusion or disinterest.
Reports in Crazy Egg are straightforward, emphasizing clear visual insights over dense statistical analysis. For small to medium-sized businesses or teams without dedicated data analysts, Crazy Egg offers a lens through which the vast sea of data becomes a navigable river, guiding improvements directly based on user interaction.
SAS Visual Analytics: The Sextant of Data Exploration
SAS Visual Analytics, on the other hand, functions as a sophisticated sextant, offering precise measurements and in-depth explorations of the data universe. It is designed to handle complex, multi-source data, providing a suite of advanced visualization tools that can uncover hidden patterns and predict future trends. With capabilities ranging from customizable dashboards to intricate graphing tools, SAS Visual Analytics allows users to dive deep into their data, offering insights that can inform comprehensive strategic decisions.
For large enterprises or organizations with complex data needs, SAS Visual Analytics offers the detailed charts and instruments necessary to navigate the deeper waters of data analysis, making it a powerful tool for those looking to harness data at scale.

Related: Check out our free SEO suite

Scalability and Flexibility: The Winds and Tides of Digital Growth
In the vast ocean of digital analytics, the scalability and flexibility of a tool are akin to the winds and tides that propel a ship forward. They determine not only how well you can navigate current waters but also how effectively you can explore new horizons as your journey evolves. This aspect is fundamental in ensuring that the analytics tool you choose can grow with your business and adapt to changing digital landscapes.
Crazy Egg: Agile and Adaptive Sailing
Crazy Egg offers a form of agility and adaptability that’s crucial for small to medium-sized businesses in rapidly changing digital seas. Its platform is designed to be straightforward, focusing on providing key insights without overwhelming users with data. This simplicity allows for quick adaptation to changes, making it easier for businesses to implement improvements and evolve their digital presence.
However, for businesses on the brink of substantial growth or those with complex needs, it’s important to consider whether Crazy Egg’s streamlined approach can fully support their expanding analytics requirements. The tool is like a swift sailboat that excels in agility but may need additional support to navigate deeper waters.
SAS Visual Analytics: Navigating Complex Seas with a Galleon
On the opposite horizon, SAS Visual Analytics stands as a robust galleon capable of navigating the complex seas of enterprise-scale data analysis. Its platform is built for depth, offering a wide range of analytical tools that can accommodate massive volumes of data and complex analysis scenarios. This makes SAS Visual Analytics ideal for large enterprises or businesses with intricate data landscapes.
The tool’s strength in scalability ensures that as your business grows, your analytics capabilities can expand to meet new challenges without sacrificing depth or precision. It’s equipped to sail through both familiar coasts and uncharted waters, making it a powerful ally for organizations charting a course through the complexities of digital growth.
Customer Support and Community Engagement: Your Compass and Crew in the Analytics Journey
This area is vital because, in the vast sea of data analytics, timely and effective support, along with a vibrant community, can be your compass and crew, guiding you through challenges and enriching your journey with shared knowledge and experiences.
Crazy Egg: The Friendly Beacon
Crazy Egg shines as a friendly beacon in the analytics world, offering accessible customer support designed to help users navigate its suite of tools with ease. This support comes in various forms, including an extensive online knowledge base, email support, and resources like blogs and guides that are rich with actionable insights. Additionally, Crazy Egg benefits from a community of users who are typically keen on sharing tips, strategies, and best practices across forums and social media platforms.
This combination of approachable customer service and a collaborative user community makes Crazy Egg particularly appealing to businesses that may not have vast resources dedicated to digital analytics but are keen on leveraging data for growth.
SAS Visual Analytics: The Sturdy Galleon With a Skilled Crew
SAS Visual Analytics, on the other hand, commands a sturdy galleon equipped with a skilled crew ready to assist with more complex analytics voyages. Offering comprehensive support, SAS provides users with access to detailed documentation, training, and direct support options, including phone and online assistance. The level of support here is deep and wide, reflecting the platform’s enterprise focus and the complex data challenges it’s designed to tackle.
Moreover, SAS boasts a robust user community, including forums, user groups, and events where professionals can exchange insights, learn from each other’s experiences, and explore new ways to harness the power of SAS Visual Analytics. This extensive support network is invaluable for organizations that rely heavily on analytics to drive decision-making and strategy.
Advanced Features and Customization: Tailoring Your Ship for the Journey
In the expansive sea of digital analytics, having access to advanced features and the ability to customize them to fit your specific needs is like having a ship that can be tailored for any voyage, whether it’s a quick jaunt to nearby shores or an extended exploration into unknown waters.
Crazy Egg: The Agile Schooner with Custom Sails
Crazy Egg proves its worth as an agile schooner in the analytics fleet by offering a suite of features that, while not as extensive as some enterprise tools, provides significant value through its focus on user experience analytics. Features like detailed heatmaps, session recordings, and A/B testing capabilities are all designed with user-friendliness in mind, ensuring that even teams without deep technical expertise can harness powerful insights.
Moreover, Crazy Egg’s platform allows for a degree of customization in how data is reported and visualized, making it easier for businesses to focus on the metrics that matter most to them. This blend of accessible features and customization makes Crazy Egg an attractive option for small to medium-sized businesses looking to navigate the digital seas with agility and precision.
SAS Visual Analytics: The Galleon with a Versatile Armada
In contrast, SAS Visual Analytics stands as a formidable galleon, accompanied by a versatile armada of advanced features and customization options. It caters to organizations that demand deep dives into their data, offering extensive capabilities in data integration, analysis, and reporting. With features that include predictive analytics, AI-driven insights, and sophisticated data modeling, SAS Visual Analytics is designed for data-heavy voyages.
The platform’s strength lies in its flexibility, allowing users to tailor dashboards, reports, and analytics workflows to their precise specifications. This level of customization and advanced feature set makes SAS Visual Analytics a go-to choice for large enterprises or businesses with complex analytics needs that require a comprehensive, adaptable toolkit.
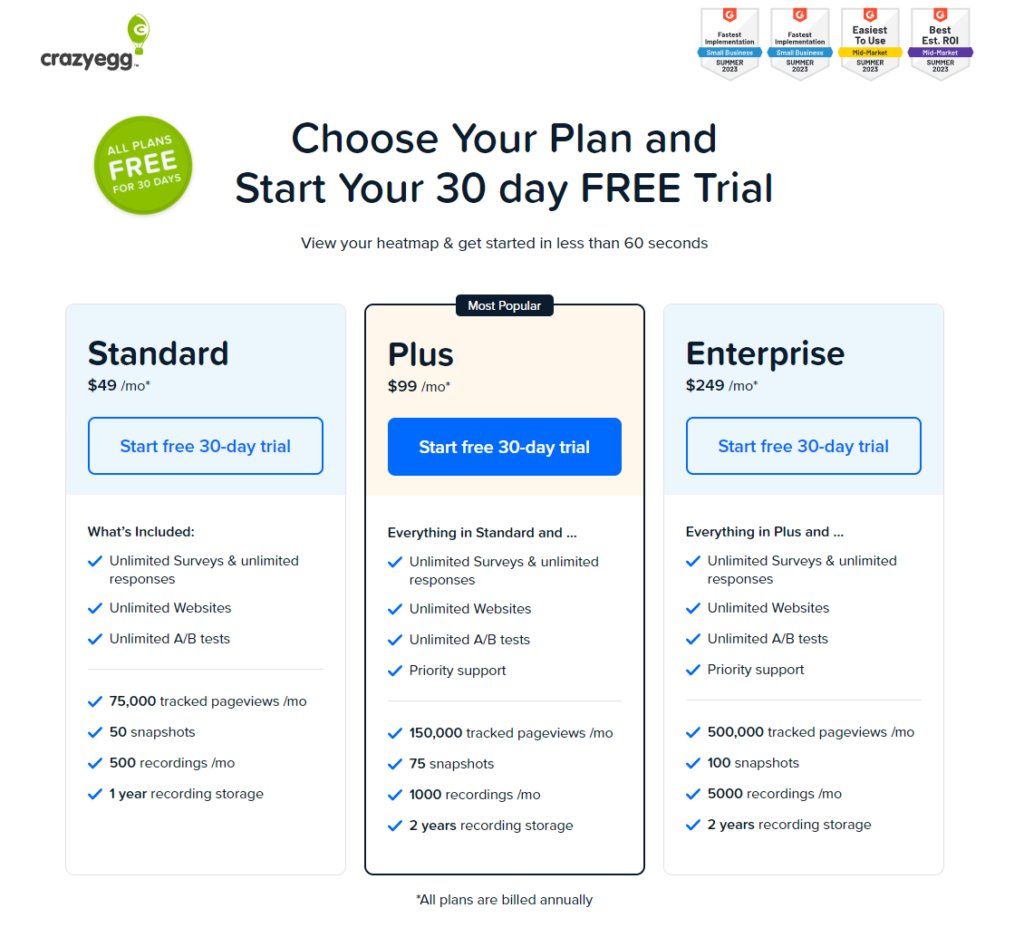
Pricing
Crazy Egg:
SAS Visual Analytics:

Conclusion
Choosing between Crazy Egg and SAS Visual Analytics hinges on understanding your digital journey’s unique requirements, ambitions, and the type of insights you seek to navigate effectively through the vast data sea. Crazy Egg, with its user-friendly interface, straightforward analytics, and focus on visual data representation, serves as an agile schooner, ideal for small to medium businesses or those embarking on their analytics voyage. It offers simplicity and immediate value, enabling quick decision-making and site optimization without deep technical expertise.
On the other hand, SAS Visual Analytics stands as a formidable galleon, equipped with a comprehensive suite of advanced features and customization options. It’s designed for large enterprises and data-heavy explorers, providing deep dives into analytics with sophisticated tools like predictive analytics and AI-driven insights. This platform caters to organizations ready to invest in a robust, scalable solution that can handle complex data landscapes and drive strategic decisions.
Read Next:
- Mailchimp vs SendinBlue: The Best Email Marketing Tool for 2024
- ConvertKit vs Moosend: The Best Email Marketing Tool for 2024
- ActiveCampaign vs EmailOctopus: The Best Email Marketing Tool for 2024
- AWeber vs EmailOctopus: The Best Email Marketing Tool
- GetResponse vs eSputnik: The Best Email Marketing Tool for 2024


Comments are closed.