WinSavvy Editorial Standards
How this article was created
In today’s data-driven world, the analytics tool you choose can illuminate the path to success or leave you wandering in the dark. Enter Crazy Egg and Microsoft Power BI, two luminaries in the realm of digital analytics, each with its own approach to shedding light on your data. But with different strengths and focuses, deciding which tool is the beacon for your business can be a challenge. Let’s embark on a journey to explore these platforms, starting with a crucial aspect that could tip the scales: User Interface and Experience.
| Crazy Egg | Microsoft Power BI |
|---|---|
| G2 Score – 4.2 out of 5 stars | G2 Score – 4.5 out of 5 stars |
| TrustRadius Score – 7.6/10 | TrustRadius Score – 8.3/10 |
User Interface and Experience

In the digital age, where data is plentiful but time is scarce, the usability of an analytics tool is paramount. It’s not just about what insights a tool can provide; it’s also about how quickly and easily you can access those insights. Let’s delve into how Crazy Egg and Microsoft Power BI stack up in providing a user-friendly experience.
Crazy Egg:

Crazy Egg is renowned for its straightforward and intuitive interface. Aimed primarily at website optimization, it offers a suite of visual tools like heatmaps, scroll maps, and session recordings that make understanding user behavior on your site a breeze. These tools are designed to be accessible, even for those with minimal analytics experience, ensuring that you can start gathering actionable insights with just a few clicks. The simplicity of Crazy Egg’s dashboard encourages exploration and experimentation, allowing users to quickly identify issues and opportunities on their websites without getting bogged down in complex data analysis.
Microsoft Power BI:

Microsoft Power BI, on the other hand, takes a more comprehensive approach to data analytics, catering to a wide range of business intelligence needs. While it offers advanced data visualization and reporting capabilities, its interface is designed to accommodate a deeper level of data exploration. Power BI’s dashboard and report builder provide a robust set of tools for slicing and dicing data, creating custom visualizations, and sharing insights across your organization.
The platform is aimed at users with a bit more experience in data analysis, offering the flexibility and power needed to handle complex datasets. However, this increased capability comes with a steeper learning curve, requiring users to invest time in learning the platform to fully leverage its potential.
Integration Capabilities
In today’s digital ecosystem, the power of an analytics tool is significantly amplified by its ability to seamlessly integrate with other software and platforms within your operational landscape. This capability enhances data accuracy, simplifies processes, and enables a more comprehensive view of business performance and customer behavior.
Crazy Egg:
Crazy Egg offers focused analytics primarily aimed at understanding and improving website user experience. Its integration capabilities are designed to complement this core functionality. Crazy Egg integrates directly with popular website platforms and content management systems like WordPress, Shopify, and Wix, making it easy for users to implement its tracking code and start collecting valuable user interaction data.
These integrations facilitate a straightforward setup process, allowing businesses to quickly gain insights into how visitors interact with their sites. However, Crazy Egg’s integration scope is primarily centered around web analytics, with less emphasis on broader business data systems or advanced analytics platforms. This makes Crazy Egg an ideal choice for businesses primarily interested in optimizing their website’s performance and user experience.
Microsoft Power BI:
Microsoft Power BI, on the other hand, stands out for its extensive integration capabilities across a wide range of data sources and business applications. As part of the Microsoft ecosystem, Power BI offers native integrations with other Microsoft products such as Azure, Office 365, and Dynamics 365, providing businesses with a unified analytics solution that can leverage data from across their entire operational spectrum. Beyond Microsoft products, Power BI supports connections to numerous external data sources, including cloud services, databases, and third-party applications.
This extensive integration capability allows businesses to aggregate, analyze, and visualize data from diverse areas of their operations, from sales and marketing to finance and supply chain management, making Power BI a powerful tool for organizations looking for comprehensive business intelligence solutions.

Related: Check out our free SEO suite

Data Visualization and Reporting Capabilities

When it comes to transforming raw data into actionable insights, the capabilities of an analytics tool to visualize and report information effectively can significantly impact decision-making processes. Crazy Egg and Microsoft Power BI cater to this need differently, reflective of their distinct user bases and primary functions.
Crazy Egg:
Crazy Egg shines in the realm of website analytics, offering a suite of visualization tools specifically designed to enhance user experience and conversion optimization. Its data visualization capabilities are highly intuitive, focusing on heatmaps, scroll maps, session recordings, and A/B testing results that provide a clear, visual representation of user behavior on a website. These tools allow website owners and marketers to quickly identify areas of their site that engage users and those that may be causing confusion or abandonment. Crazy Egg’s reporting is straightforward, emphasizing visual data that can be easily interpreted and acted upon, making it particularly appealing for users looking for quick insights to improve their website’s performance.
Microsoft Power BI:
Microsoft Power BI, on the other hand, stands out as a comprehensive business intelligence platform with extensive data visualization and reporting capabilities that extend beyond website analytics. Power BI enables users to create complex dashboards and reports that can incorporate data from a wide array of sources, including cloud services, databases, and even Excel spreadsheets.
Its strength lies in its flexibility and depth, offering a range of visualization options from basic charts to advanced data models that can illuminate trends, patterns, and correlations across large datasets. Power BI’s reporting tools are designed for customization, allowing businesses to tailor reports to their specific needs and share insights across teams and departments. This level of sophistication makes Power BI a powerful tool for organizations requiring detailed analytics that inform broader strategic decisions.
User Accessibility and Learning Curve

The accessibility of an analytics tool, along with the learning curve required to effectively use it, can significantly impact how quickly a business can start seeing value from their data analytics efforts. Both Crazy Egg and Microsoft Power BI offer powerful analytics functionalities, yet they cater to users with different levels of expertise and resources available for learning and development.
Crazy Egg:
Crazy Egg is renowned for its focus on user-friendly analytics, specifically tailored for website optimization. The platform is designed to be intuitive, with a straightforward interface that allows users to start gathering insights with minimal setup. The visual nature of Crazy Egg’s heatmaps, scroll maps, and session recordings means that understanding the data doesn’t require advanced analytics knowledge. This ease of use extends to its A/B testing features, making Crazy Egg an accessible tool for marketers, content creators, and web designers looking to enhance the user experience on their sites without a steep learning curve.
Microsoft Power BI:
Microsoft Power BI, while offering a suite of powerful business intelligence tools, presents a more substantial learning curve. It’s built to accommodate a wide range of analytics needs from simple data visualization to complex data modeling and analysis across various data sources. Power BI’s depth and breadth of capabilities mean that unlocking its full potential often requires a solid understanding of data analytics principles.
However, Microsoft has invested in extensive resources, including tutorials, forums, and documentation, to support users in climbing this learning curve. For organizations with dedicated data analysts or teams willing to invest in training, Power BI’s advanced features can be harnessed to provide comprehensive insights that inform strategic decisions across the business.
Pricing and Value for Money

When it comes to selecting an analytics tool, budget considerations play a significant role. Both Crazy Egg and Microsoft Power BI offer various pricing tiers, each designed to meet the needs of different business sizes and scopes. Understanding the cost relative to the features and capabilities you receive is essential in assessing which tool provides the best value for your investment.
Crazy Egg:
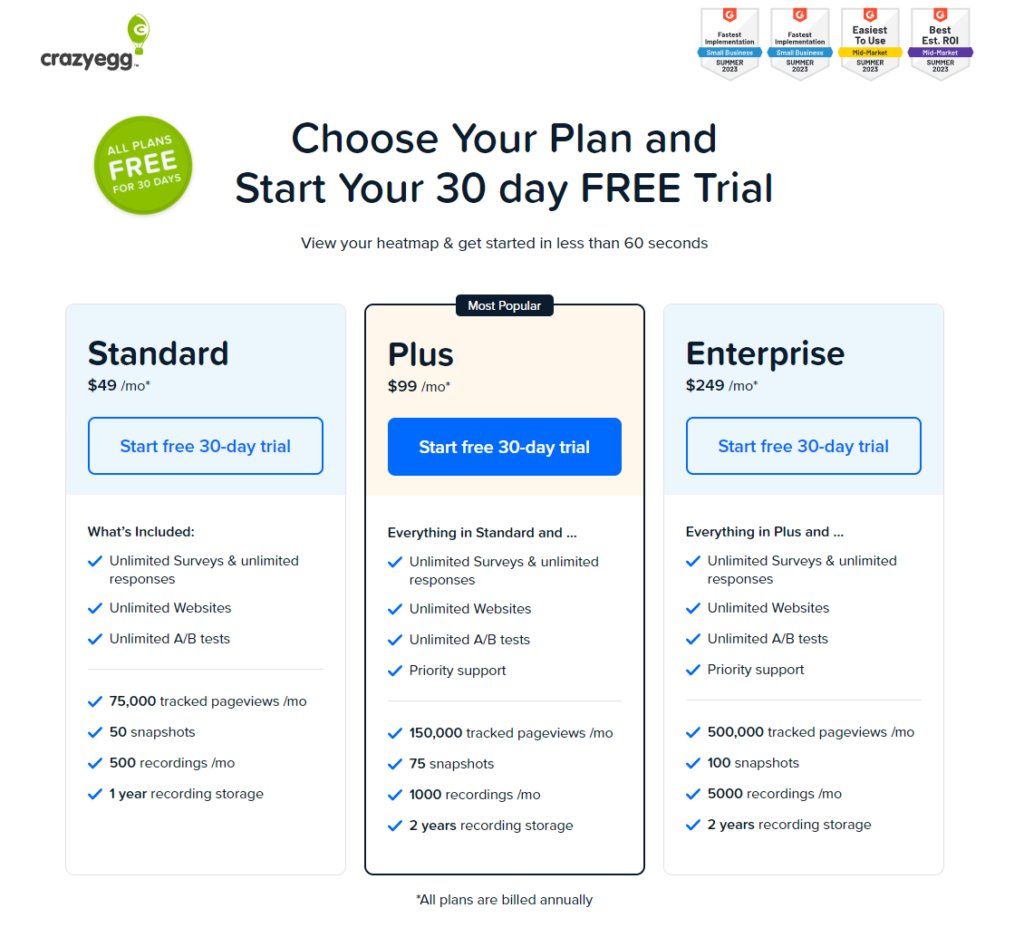
Crazy Egg adopts a straightforward pricing model, with plans based on the number of pageviews your site receives and the features you need access to. Starting with a basic tier suitable for small websites looking to gain initial insights into visitor behavior, to more advanced plans that offer additional features like A/B testing, advanced targeting, and more comprehensive reporting options. Crazy Egg’s approach is to offer scalable solutions that grow with your website’s traffic and your business’s evolving needs. The focus on website optimization tools within each pricing tier makes Crazy Egg an attractive option for businesses primarily concerned with enhancing user experience and conversion rates on their websites.
Microsoft Power BI:
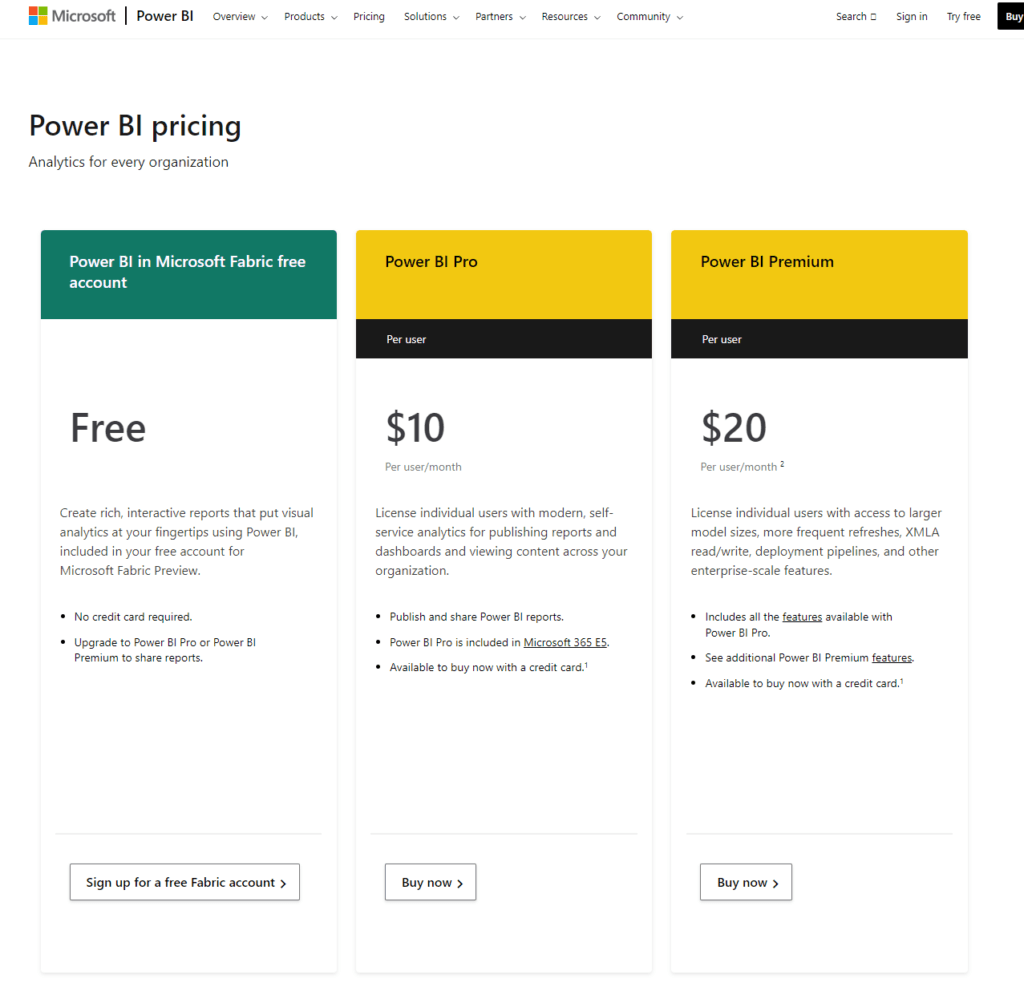
Microsoft Power BI, on the other hand, is structured around a freemium model, with its free version offering a generous array of features suitable for individual users or small teams just starting with data analytics. For more advanced business analytics capabilities, including data governance, collaboration tools, and larger data processing capacities, Power BI Pro and Power BI Premium plans are available. These paid options cater to businesses with more complex analytics needs, requiring detailed reporting, data modeling, and real-time analytics across multiple data sources. Power BI’s pricing structure is designed to accommodate the breadth of enterprise-level analytics requirements, offering a robust platform for data analysis, visualization, and sharing.
Conclusion
Wrapping up our comparative analysis between Crazy Egg and Microsoft Power BI, we’ve journeyed through key considerations that play a pivotal role in selecting the right analytics tool for your business. From the intricacies of data visualization and reporting capabilities to the nuances of user accessibility and the learning curve, each platform presents its own set of strengths and challenges, catering to distinct user needs and operational contexts.
Crazy Egg shines as a specialized tool tailored for website optimization, offering straightforward, visual analytics focused on enhancing user experience and improving conversion rates. Its intuitive interface and ease of use make it an excellent choice for businesses seeking quick, actionable insights into website visitor behavior without the need for extensive technical expertise. Crazy Egg’s approach is ideal for small to medium-sized businesses, marketers, and web designers who prioritize immediate understanding and optimization of user interactions on their sites.
Microsoft Power BI, on the other hand, stands out as a comprehensive business intelligence platform designed for in-depth data analysis across an entire organization. With its robust capabilities in data integration, complex reporting, and advanced analytics, Power BI is suited for businesses with dedicated data analysis teams or those willing to invest in the training required to leverage its full potential. Its extensive suite of tools supports strategic decision-making, offering valuable insights that can influence various aspects of business operations, from marketing strategies to financial planning and beyond.
Read Next:


Comments are closed.